iXon Ultra 897 EMCCD
View Product


When the aim of an experiment is to image single molecules, autofluorescence background can impede their detection. In cells, a major contribution to the fluorescence background is from autofluorescence from within the cell. One of the ways that is used to reduce the background and improve the signal to background is by using Total Internal Reflection Fluorescence (TIRF) imaging. However, TIRF limits the excitation to a thin layer a few hundred nanometers thick. This is well suited to studying processes close to the cell membrane, but does not provide sufficient imaging depth to study molecules as they are internalised, or to image organelles within the cell. Another approach is by shifting the excitation and emission spectra to longer wavelengths in the near infra-red (NIR) region as this is known to reduce autofluorescence and scattering.
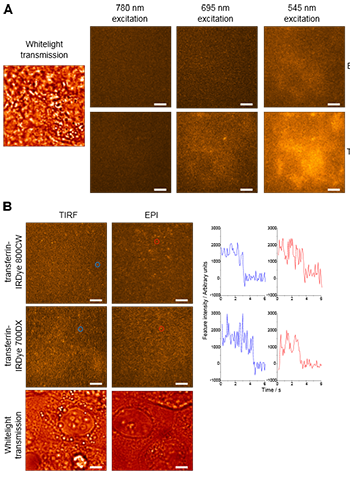
Figure 1. Autofluorescence background and single NIR molecules in MCF-7 cells. A. Images of a single area of unlabelled MCF-7 cells independently illuminated with broadband 780 nm, 695 nm and 545 nm light demonstrate a decrease in autofluorescence background with increasing excitation wavelength. A whitelight transmission image indicates the position of cells within the field of view. B. Images of single molecules of transferrin-IRDye 700DX and transferrin-IRDye 800CW on MCF-7 cells simultaneously illuminated with broadband 780 nm and 695 nm light. Typical intensity vs. time traces, of the molecules highlighted by red and blue circles, are shown to the right.
One example that illustrates this well was by Dr. Stephen Webb and his research team at the Central laser facility, Didcot, UK. Dr Webbs research group investigated the brightness, photostability and blinking characteristics of a range of commercially available organic NIR dyes under the same conditions to study their use for single molecule imaging in cells. In this study, NIR dyes that could be excited at 695 nm or 780 nm, and MCF-7 cells, a commonly used breast cancer cell line that produces a noticeable autofluorescence background when illuminated with visible wavelength light were selected.
Single molecule studies often rely on obtaining as high a signal level (quantum yield and brightness) as possible so the four brightest NIR dyes based on initial ensemble fluorescence screening experiments were determined for the following experiments. These dyes were: Alexa 700 and IRDye 700DX (excited at 695 nm) and Alexa 790 and IRDye 800CW (excited at 700 nm). The parameters that were studied were: single molecule intensity, photobleaching rate and blinking characteristics. The results of this study showed that both IRDyes had mean intensities superior to the corresponding Alexa dye, although the difference between Alexa 700 and IRDye 700DX was minimal. Concerning photobleaching, IRDye 700DX was more photostable than Alexa 700, whereas IRDye 800CW and Alexa 790 displayed similar photobleaching kinetics.
To investigate the contribution of blinking to the measured photobleaching kinetics, histograms of fluorescence emission periods were produced from the same datasets. A single exponential decay curve was fitted to these histograms to obtain the mean time that each dye continuously emitted before entering the dark state (the ‘on-time’). The duty cycle for each molecule was defined as the summed emission periods divided by the time elapsed when the final bleaching event occurs. Alexa 700 had an average ‘on-time’ of less than one second, and a duty cycle of 0.62, i.e. Alexa 700 intensity traces comprise short bursts of emitting fluorescence, with non-emitting, dark periods lasting several seconds. In comparison, IRDye 700DX had an average ‘on-time’ of 1.4 seconds and a higher duty cycle, indicating that the dye emits for longer periods, punctuated by brief periods in a dark state. Of the longer wavelength dyes, it was found that IRDye 800CW had a marginally longer ‘on-time’ and a greater duty cycle than Alexa 790.
The four NIR dyes under investigation were then tested by imaging in the MCF-7 cells. Initially unlabelled MCF-7 cells were imaged and a decrease in the autofluorescence background was observed as expected with increasing wavelength. When cells were excited at 780 nm almost no background was observed above the detector noise (Fig 1 A). Labelling cells with transferrin-IRDye 700DX and transferring-IR Dye 800CW revealed that the total background intensity reduces with increasing wavelength with both epi and TIRF illumination (Fig 1 B). Additionally, it was discovered that IRDye 700DX was not bright enough for epi-fluorescence illumination but IRDye 800CW maintained a sufficient signal to background ratio when imaged in this mode.
Andor’s solution for multi-wavelength imaging of single molecules
To measure the weak signals from single molecules it is very important to choose a highly sensitive detector. Andor’s range of iXon Ultra EMCCD’s are the ideal detector for single molecule imaging. They exhibit the ability multiply the photoelectron signal on the camera prior to the readout stage thus defeating the noise floor set by the read noise of sCMOS cameras. All without having to increase exposure times or illumination intensity, meaning that photobleaching is minimised. The iXon range of EMCCD cameras can achieve very high frame rates in combination with extremely low read noise, again making them highly sensitive for single molecule detection. In order to capture multiple wavelengths simultaneously a dual iXon EMCCD camera configuration was used.
Need to image thicker tissues and reduce autofluorescence and scattering further?
In recent years a range of NIR II (SWIR) dyes have been developed that enable even higher signal to background ratios. For these imaging experiments a silicon based sensor that is found in sCMOS and CCD cameras is not suitable as there is no response past 900nm. An alternative sensor technology is required. Andor provide a range of InGaAs cameras that provide sensitivity within the NIR II spectral range. You can find out more here: First Light Imaging Cameras - Andor - Oxford Instruments (oxinst.com)
© Oxford Instruments 2026