Precision. Accuracy. Resolution. These are all words that infer a sense of scientific quality and rigour and, as such, are regularly used in the brochures and technical specifications for scientific instrumentation. Electron backscatter diffraction (EBSD) systems are no different: for example, the technical datasheet for our AZtecHKL EBSD software mentions “resolution” 6 times, “precision” 4 times and “accuracy” twice. But how important are these concepts for EBSD? In this post, I want to consider just one of them – precision.
Precision v Accuracy
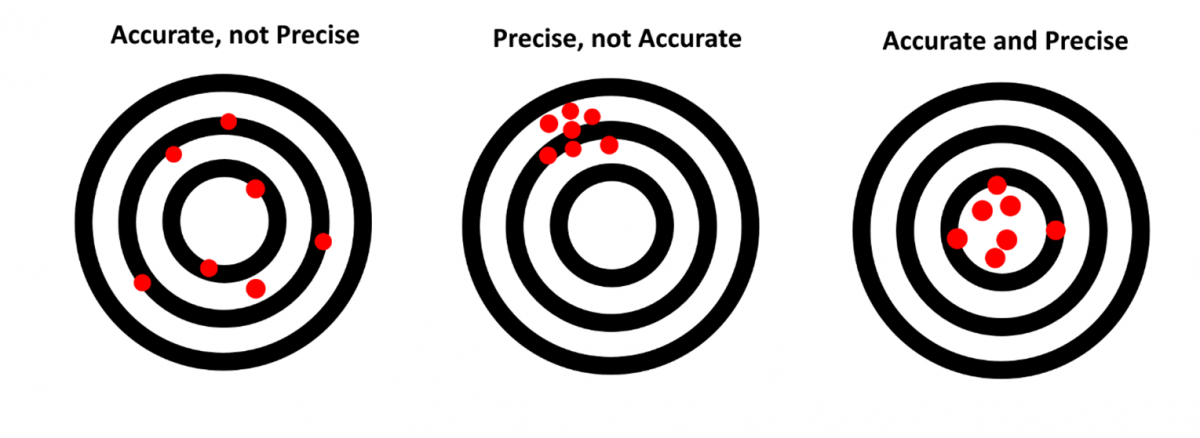
First of all, we need to understand the concept of precision, and why it is not the same as accuracy. An EBSD system takes a diffraction pattern from a point on the surface of a sample and interrogates the arrangement of the Kikuchi bands within the pattern to determine the phase (crystal structure) and the crystallographic orientation. The orientation is measured relative to a sample reference frame (i.e. the cut and polished sample surface), but it is usually more useful to relate it to the original sample axes, such as the rolling, normal and transverse directions. The accuracy of this measurement – how close the measured orientation is to the ground truth – can be affected by many factors, such as the way the sample was cut, the mounting process, the microscope stage and the calibration of the EBSD system itself. Typically the accuracy is quite poor, likely in the region of 1-2°. The precision of the orientation measurement, on the other hand, relates to how repeatable the measurements are under the same experimental conditions. For example, if you have a recrystallised grain of copper from which 100 EBSD patterns are collected and indexed, the orientation results should all be identical; any spread in measured orientations is an indication of the precision (or lack of) in the EBSD analyses. This is nicely summed up by the following image, taken from our www.ebsd.com website:
The Benefits of Higher Precision
Precision is very desirable in EBSD measurements since a higher precision will allow us to measure smaller changes in orientation – for example, with a precise EBSD measurement, we can detect and visualise the very small orientation changes associated with dislocation cell walls in deformed materials or, in some cases, the individual growth defects in semiconductors, such as threading dislocations in GaN thin films. We can see this benefit in the following EBSD maps, showing some deformed plagioclase feldspar grains in a deformed igneous rock sample. The increased precision of the data used for the second image reveals the details of the dislocation structures much more clearly.
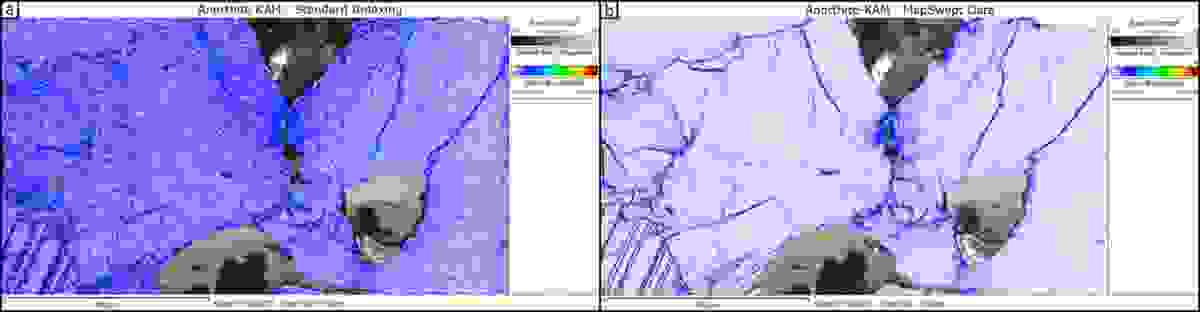
Kernel average misorientation (KAM) maps from some plagioclase feldspar grains in a deformed rock sample. The left map (a) was collected using standard Hough-based indexing, whereas the right map (b) was reprocessed using a pattern matching refinement sweep in AZtecCrystal MapSweeper. The improved angular precision in (b) reveals many more of the details of the dislocation structures within the plagioclase grains. Both maps are plotted using the same KAM parameters and colour scale.
However, the precision of the orientation data has an even more dramatic effect on the precision of the directional measurements associated with small orientation changes – such as the rotation axes across boundaries, or the direction of Burgers vectors (as measured using the “weighted Burgers vector” method in our Dislocation Analysis tool in AZtecCrystal). This was discussed in a paper published back in 1999 by Dave Prior (“Problems in determining the misorientation axes, for small angular misorientations, using electron backscatter diffraction in the SEM”, J. Microscopy 195) in which the angular errors for each orientation measurement were estimated at ~1°, and their impact on the measurement of rotation axes associated with low angle boundaries was investigated. The conclusions ended with the following statement: “Individual misorientation measurements of low-angle boundaries need to be treated with caution. New EBSD techniques need to be developed to accommodate this requirement.”
This statement holds true today but, fortunately, new EBSD techniques have been developed that have significantly improved the precision of our EBSD orientation data. These include the patented “Refined Accuracy” indexing method within our AZtecHKL software (immediate solution refinement using the curved Kikuchi band edges) and, more recently, the pattern matching refinement now available using the MapSweeper software in AZtecCrystal. Even the standard Hough-based band detection has been significantly improved over the past 2 decades, so that the angular errors associated with each orientation measurement are now more typically 0.2-0.5° (the true value will depend on the phase in question, the EBSP resolution and the electron dose for each measurement). Refined Accuracy lowers this error to below 0.05°, with MapSweeper now able to reach 0.01° precision or better.
Application Example
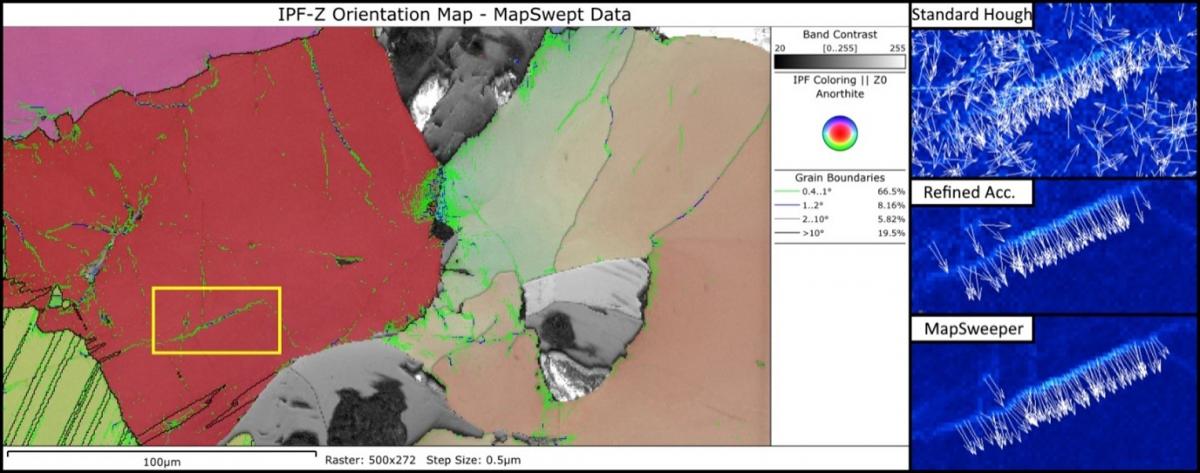
The impact of this improved precision on the interpretation of EBSD data can be quite profound. Let us return to the example shown earlier, from the deformed igneous rock. We can compare analyses using the standard Hough-based indexing, the Refined Accuracy method and, with the highest precision of all, refinement using AZtecCrystal MapSweeper. The image below shows the orientation map (from the MapSweeper refined data) and focuses on a single low angle boundary with ~1° disorientation. The graphical representation of the orientation of the weighted Burgers vectors (as calculated using AZtecCrystal’s Dislocation Analysis tool) are then provided for this boundary, for the 3 different datasets.
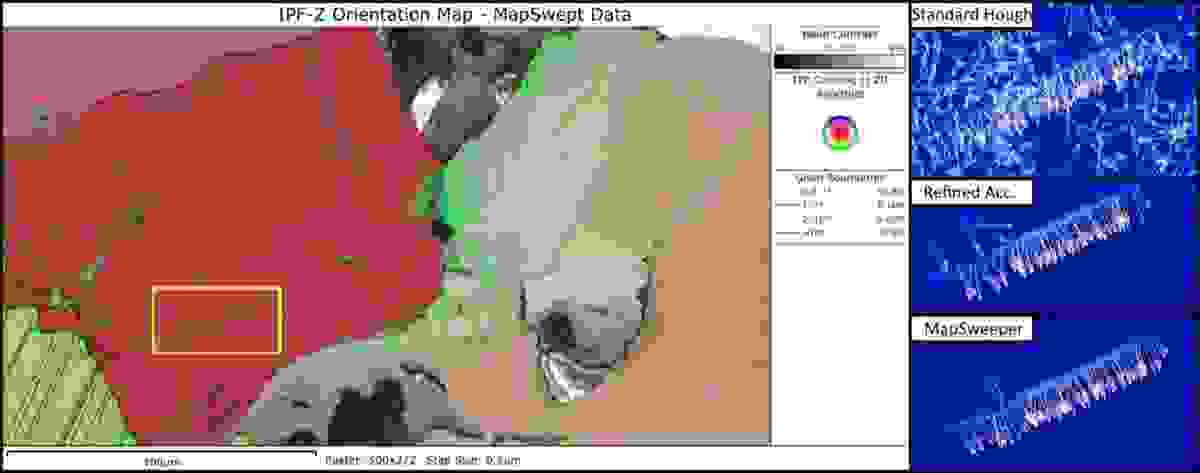
Orientation map (MapSweeper refined data) from the plagioclase feldspar grains, showing multiple low angle boundaries. The ~1° boundary in the yellow box is then analysed using the weighted Burgers vector (WBV) method, with the results using 3 different measurement methods (standard indexing, Refined Accuracy and MapSweeper Refinement) shown to the right (arrows indicate the orientation of the WBVs at each point). Only weighted Burgers vectors with a magnitude > 0.015 µm / µm2 are displayed. Note the improved consistency in WBV orientations with increasing measurement precision.
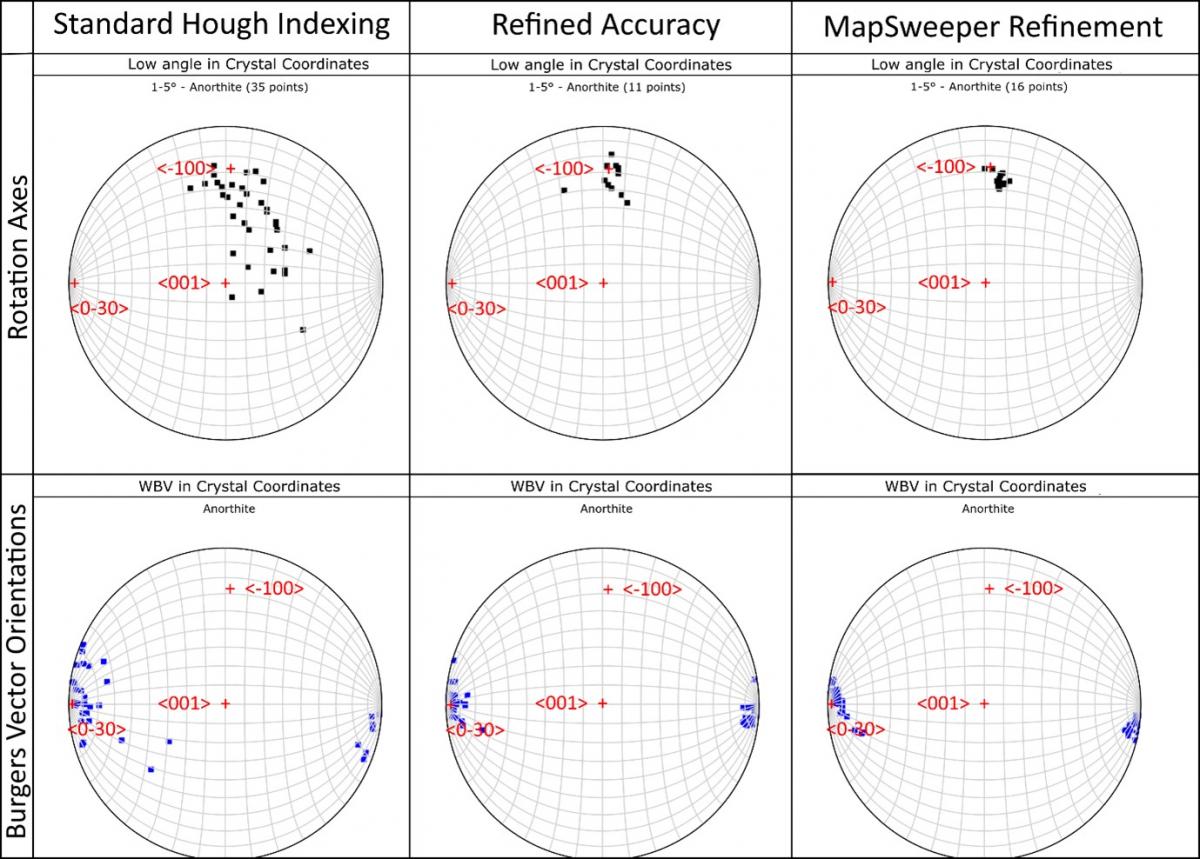
The improved precision and reliability of the weighted Burgers vector orientations with a higher measurement precision are very clear. However, the improvement is even more marked when plotting the orientation of the rotation axes associated with this boundary. This is shown in the image below – for standard indexing (with a measurement precision of ~0.5°), there is up to 90° spread in the measured rotation axis orientations. For refined accuracy (precision ~0.05-0.1°) this spread drops to ~30°, whereas for the MapSweeper refined data (here with a precision of ~0.02°) the spread is under 10°. A similar picture is shown for the weighted Burgers vector orientations, although the integral method of calculating the WBV reduces the impact of the angular errors in the orientation measurements. It is worth noting that these data were collected using relatively low resolution EBSD patterns (156x128 pixels) – even better precision could be achieved with higher resolution patterns.
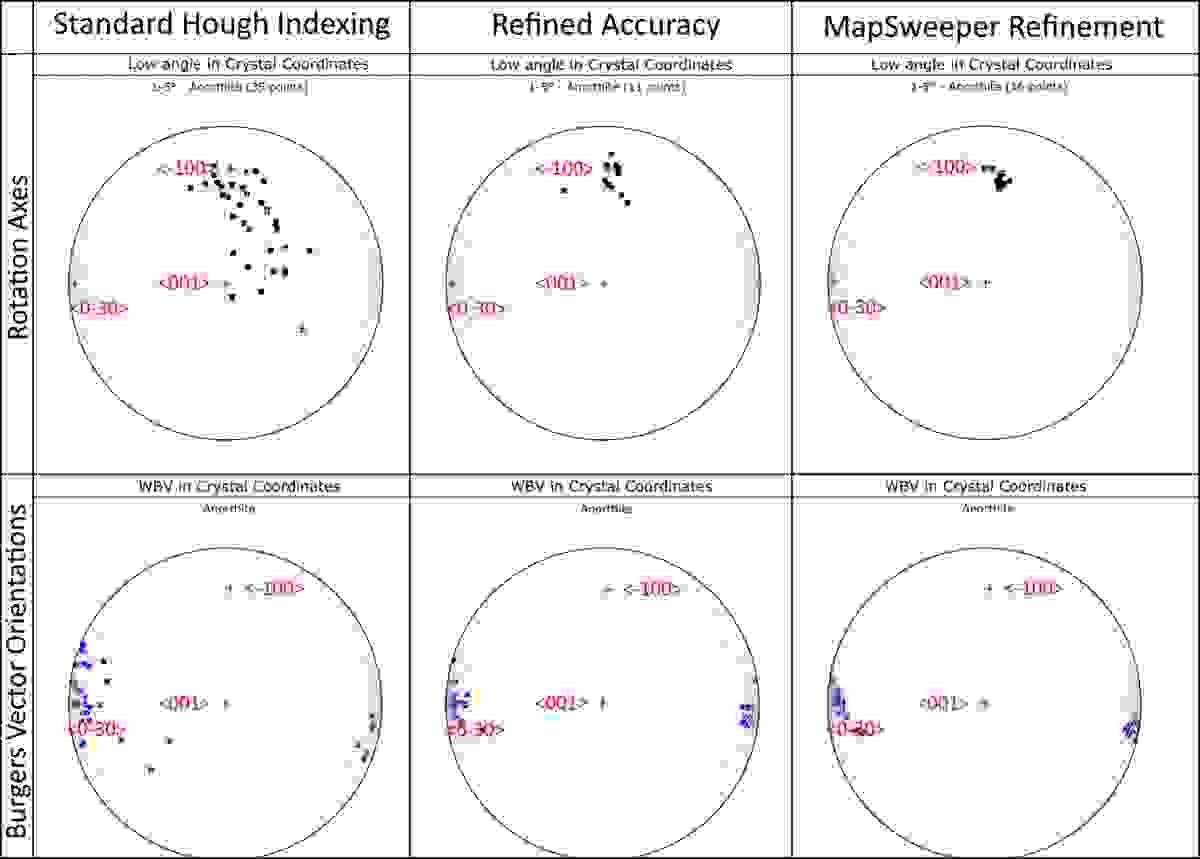
A comparison between the different methods of orientation measurement (Hough-based indexing, Refined Accuracy and MapSweeper Refinement) showing their impact on the precision of the measurement of the rotation axes and the weighted Burgers vector orientations associated with the ~1° boundary highlighted in the previous image. Note the significant drop in measurement scatter (i.e. improved measurement precision) when using the Refined Accuracy and, most clearly, the MapSweeper Refinement methods.
Summary
So, is this just an academic exercise? No, not at all! In this particular sample, we are interested in understanding the mechanisms of deformation of this igneous rock and to do that we want to identify specific slip systems that are active in the different minerals. The improved precision that is afforded by the Refined Accuracy and, especially, the MapSweeper Refinement methods of indexing allow us to identify with much greater confidence the rotation axes and weighted Burgers vector orientations associated with low angle boundaries. In the case above, we can see that the rotation axis is clearly clustered about <-100> (this would not be apparent if we used the standard Hough-transform indexed data), with the Burgers vector apparently aligned close to the <0-10> axis. This is an interesting result, warranting further investigation, since the [010] Burgers vector is not consistent with any well-known slip system in plagioclase feldspar. It is worth mentioning that for the whole sample, EBSD data indicates a dominant <001> Burgers vector and slip on the relatively common [001](010) slip system.
Whatever conclusions are drawn from this analysis, we can safely state that the angular precision of EBSD data really does matter. The improvements in precision afforded by the pattern matching refinement in AZtecCrystal MapSweeper enable us to visualise and extract more details about dislocation structures, leading ultimately to a better understanding of the way our samples have been deformed.