Introduction
Additive manufacturing (AM) has a wide range of applications across many industries including aerospace, automotive, healthcare and construction. The metal powders used in AM are the building blocks on which the technique is based. In order to ensure the production of high-quality products that are resistant to failure, it is essential that the individual particles within the powders have the necessary morphology, size distribution and chemical composition, as well as being completely free from contaminants.
AZtecAM is an automated system developed specifically for the rapid analysis and classification of AM powders, using an energy dispersive X-ray spectrometry (EDS) system in the scanning electron microscope (SEM). The benefit of AZtecAM over conventional imaging-only classification tools is that it can perform both morphology and full compositional classification, providing a more complete characterisation of AM powders. This process can be completed at speeds in excess of 1,500,000 particles per hour for morphology only characterisation and at rates in excess of 120,000 particles per hour for full morphology + compositional screening.
Here we consider the use of AZtecAM for the routine characterisation of gas atomised high-purity copper powders. We demonstrate how particles across the population can be assessed and how contamination can be easily detected and classified.
Sample and Data Acquisition
The gas atomised high-purity copper powders were evenly dispersed on a stub with a carbon sticky tab. The sample was characterised using a field emission gun (FEG) SEM equipped with an AZtecAM system and a large area Ultim™ Max 170 silicon drift detector (SDD). EDS data was collected using a 20 kV beam energy, and an automated large area analysis was performed in order to collect statistically representative data from across the sample.
Particle Morphology Characterization
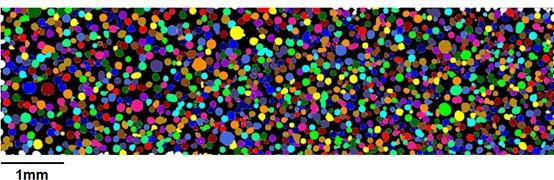
The sample was imaged using the SEM’s backscattered electron (BSE) detector. Contrast in BSE images is related to the mean atomic number (Z) of the images phases, making it the ideal detector for determining particle locations as well as variations in composition. Since the metal powders have a higher mean atomic number than the carbon tab, they appear brighter in BSE images. In such cases particles can be identified and separated from the background by means of a single greyscale thresholding approach. Morphology measurements are then instantly performed on those particles, detailing a comprehensive range of parameters that can be used in classification. All of the measured parameters can be interacted with for interpretation using a range of visualisation tools including histograms and scatter plots. Figures 1 and 2 show the results of an automated morphological characterisation of a gas-atomised copper powder sample containing both spherical and elongated particles.
The particle size distribution was measured across an area of 22 mm2 with approximately 1358 particles detected in only 8 minutes.
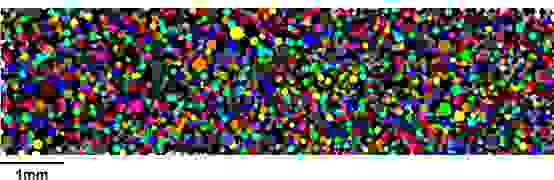
Figure 1: Automated large area analysis covering an area of 22mm2, showing the individual detected particles.
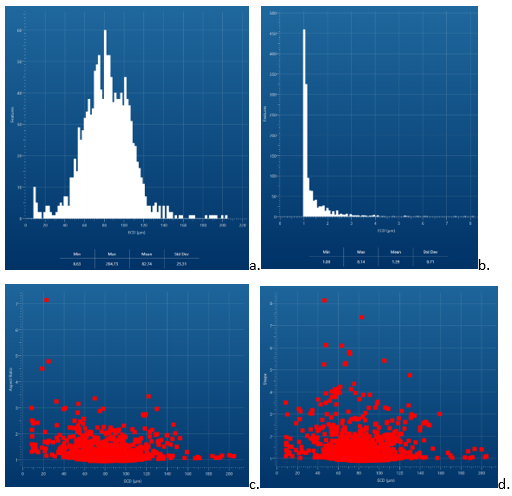
Histograms of the equivalent circle diameter (ECD) and shape factor (roundness) of the particles are plotted in Figures 2a. and 2b., showing that the mean ECD of the particles is 83 μm and the mean shape factor is 1.4.

Figure 2a. and b.: Histograms of ECD and shape factor; 2c. and d. correlations of ECD vs aspect ratio and ECD vs shape factor.
ECD vs aspect ratio and ECD vs shape factor were also plotted on scatter plots in Figure 2c. and 2d. In this sample, there was no observable correlation between these parameters – this negative result is still important. These measured properties for the complete dataset can be compared to powder specifications or process requirements to determine if the powder is fit for use.
More statistical information can be obtained from the morphological characteristics collected by AZtecAM, such as the D10, D50, and D90 particle sizes shown in Table 1 (the ECD of the largest particle corresponding to the accumulation of 10%, 50%, and 90% in the distribution curve). Table 2 lists the particle size distribution according to ASTM B214-16.
|
D10 |
D50 |
D90 |
| ECD/μm |
54.0 |
82.5 |
111 |
Table 1: D10, D50 and D90
| Particle size μm |
Mass % |
Particles % |
| >180 |
0.2 |
0.6 |
| 150-180 |
11.8 |
0.4 |
| 106-150 |
48.4 |
14.0 |
| 75-106 |
31.0 |
47.7 |
| 45-75 |
2.6 |
32.6 |
| ≤45 |
5.9 |
4.7 |
|
Table 2: Size distribution according to ASTM B214-16
Detecting contaminants and EDS analysis
The location of thresholded particles can be used to automatically determine where EDS measurements should be taken. EDS data was automatically acquired by this method from every particle in the area shown in Figure 1 to detect and identify impurity particles. A combined measurement of their morphology and composition can be made quickly to both help in determining how dangerous their presence is and their potential sources.
EDS spectra were collected with a live time of 0.05s per particle, with immediate quantification of the composition followed by instantaneous classification using a pre-loaded classification recipe. This permitted the accurate identification of all particle types in real time.
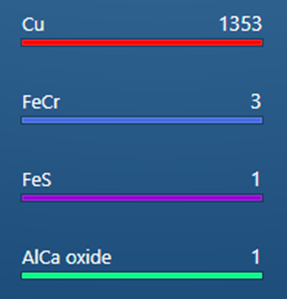
The results show that, in addition to the expected pure copper particles, contaminants included 3 Fe-Cr particles, 1 Fe-S particle and 1 Ca-Al-O particle, as shown in Figure 3a.
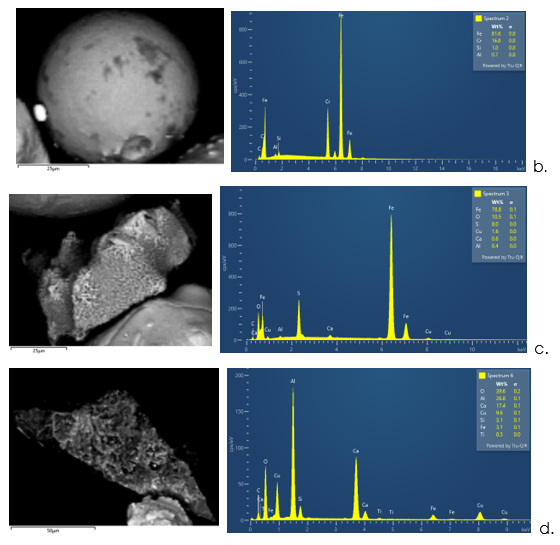
Figure 3a.: Classified contaminant particles from the copper powder sample. Individual BSE particle image, EDS spectrum and composition of 3b. Fe-Cr 3c. Fe-S and 3d. calcium aluminium oxide.

Figures 3b-d. show examples of the morphology and composition of different contaminant particles. Fe-Cr particles are typically spherical with Fe-S and calcium aluminium oxide particles more irregular in shape. It is inferred that the Fe-Cr particles may be the powdering residue from the previous batch. The iron sulphide and calcium aluminium oxide particles may be introduced impurities.
Conclusion
Here we have shown that AZtecAM is a powerful tool for the analysis of all aspects of AM powder samples. Rapid characterisation provides full morphological and chemical details of the individual particles, enabling a quick assessment of the quality of an AM powder batch and instant detection and classification of any impurities or contaminants. In this example, a number of Fe-Cr, Fe-S and Ca-Al-O particles were detected in a gas atomised high-purity copper powder, allowing for an effective assessment of the source of such contaminants.
The latest AZtecAM algorithms coupled with large area Ultim Max silicon drift detectors enable extremely rapid, fully automated powder characterisation, ensuring that powders meet the specifications for the manufacture of high-quality additively manufactured components.