In my previous blog post, we looked at an example using AZtecSteel to analyse steel inclusions by EDS and reporting to a published standard method i.e. ASTM E2142, DIN 50602, ISO 4967 etc. In this blog, we describe the analysis of oxide inclusions that is best addressed with a SEM equipped with EDS controlled by AZtecSteel and automatically reporting to a method developed by the company Pirelli on the degree of contamination of the steel by oxide inclusions.
Aim
Wire rod is used for many products, including wire ropes, springs, electrodes, fasteners, automobile components, hardware manufacturers, etc. For some applications, it requires fine wire with very high mechanical properties. However, fractures might occur during the wire drawing process and one of the main types of fracture is due to inclusions. Consequently, in the case of wire rods, inclusion control, particularly on oxides, is one of the most fundamental properties to be secured. Therefore, it is important to determine the chemical composition, to determine both number and size of the oxides present in the rod wire, to establish its suitability for use in the production of steel cord.
Detecting Inclusions and EDS Analysis
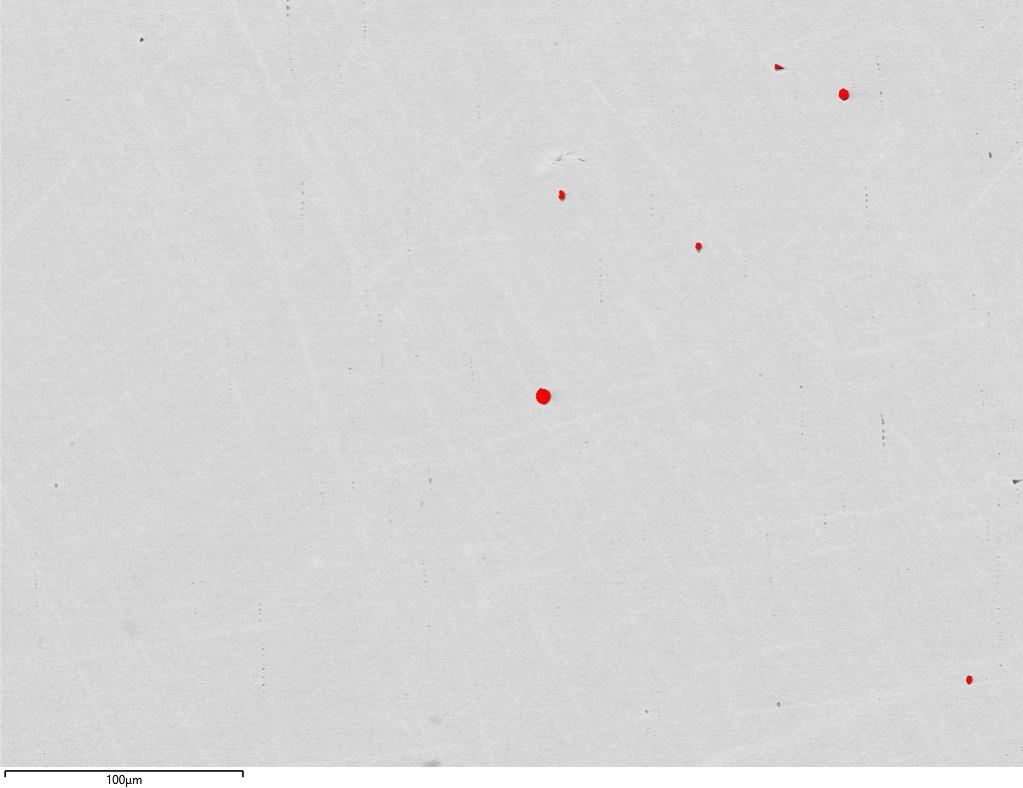
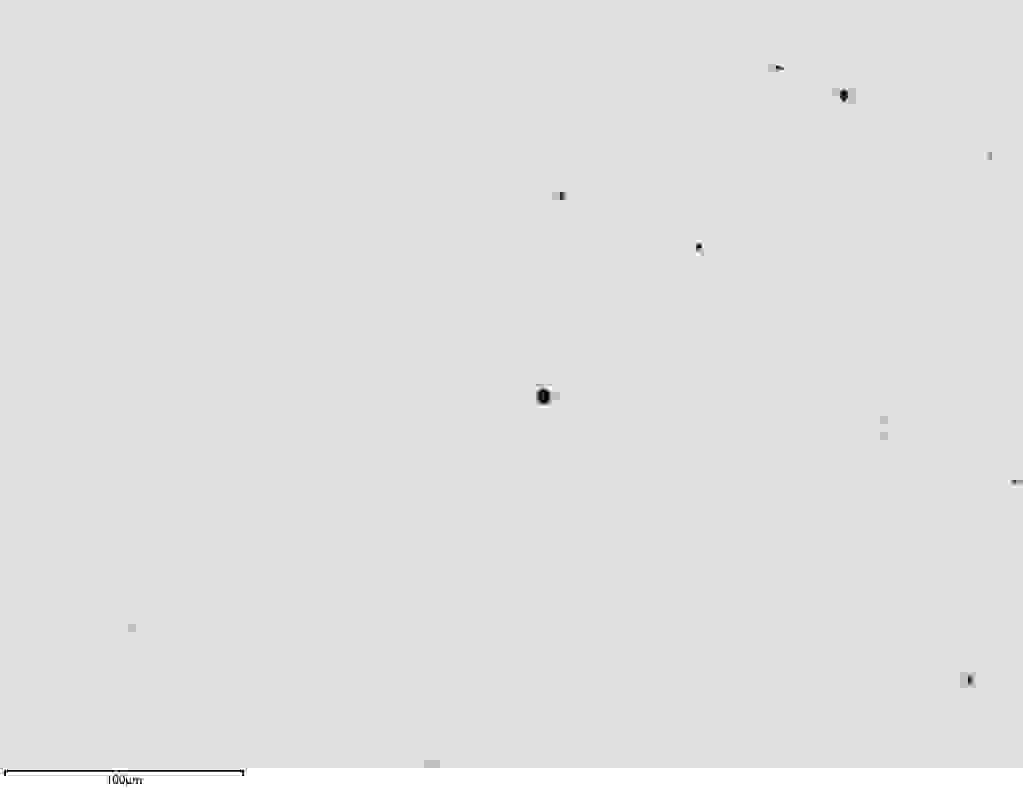
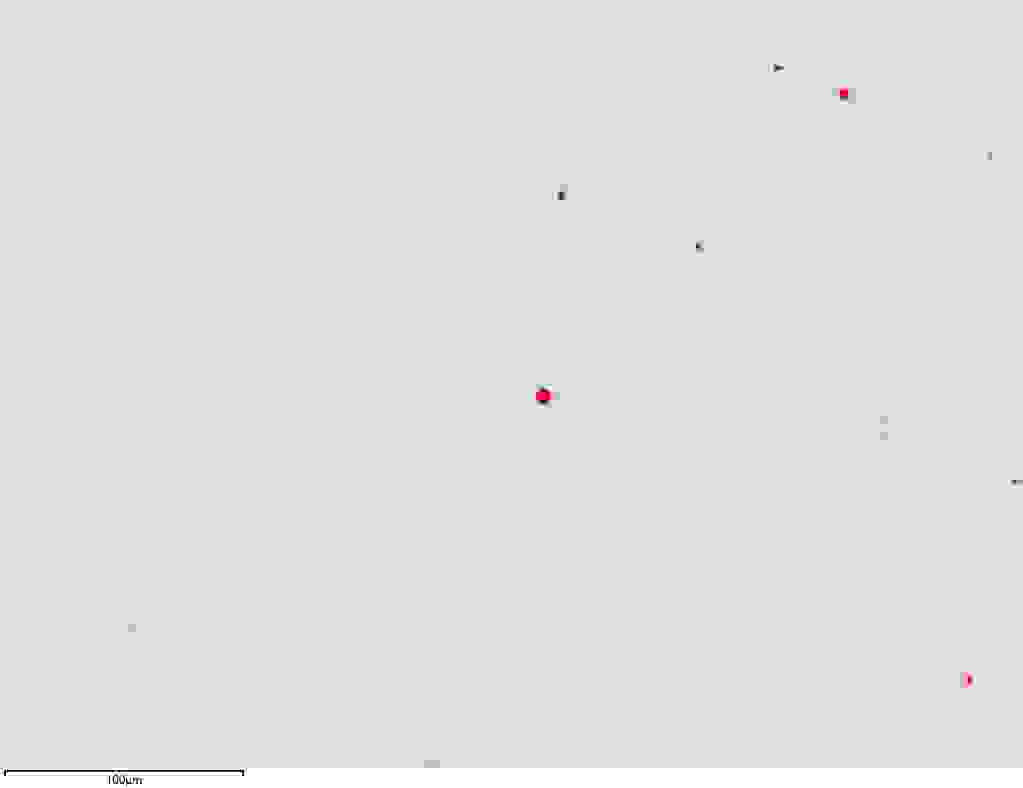
In this example, six samples, taken from different rolls, are analysed. Each sample was imaged using the SEM backscattered electron (BSE) detector. Contrast in BSE images is related to the density of the phase, making BSE imaging ideal for finding inclusions. Oxides are made of lighter elements (i.e. Al, Ti, Si, Mg, Ca, O) than Fe and MnS (if existing), as such, they appear darker than the Fe matrix and MnS in the BSE image as shown in Figure 1. In such cases, the oxides are identified and separated from the steel matrix and MnS by means of a single grey level threshold.
a.
b.
Figure 1 a.: BSE image showing inclusions; b.: Inclusions are identified, coloured by a single grey level threshold.
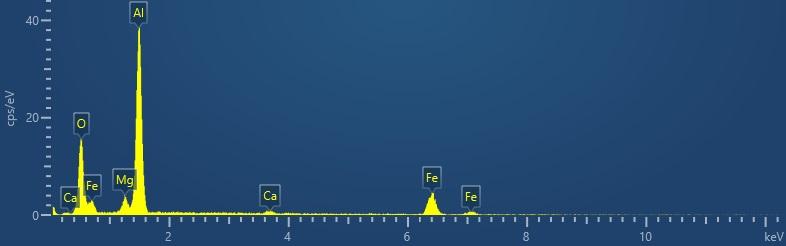
The threshold information was used to automatically determine where EDS measurements should be taken. The morphology of all oxides falling within the threshold was measured automatically and combined with compositional data from the subsequent EDS analysis. Figure 2 shows typical spectra acquired from an oxide in the sample at 20 kV.
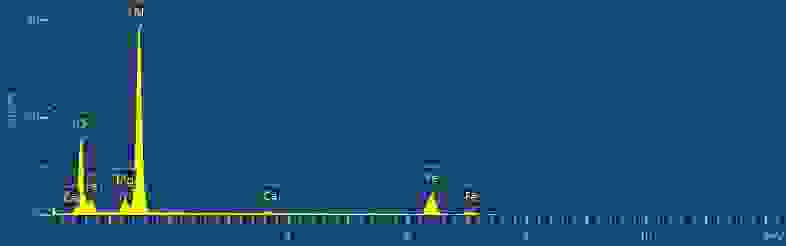
Figure 2: Typical spectra acquired from oxide in the sample at 20 kV.
Reporting to Pirelli Method
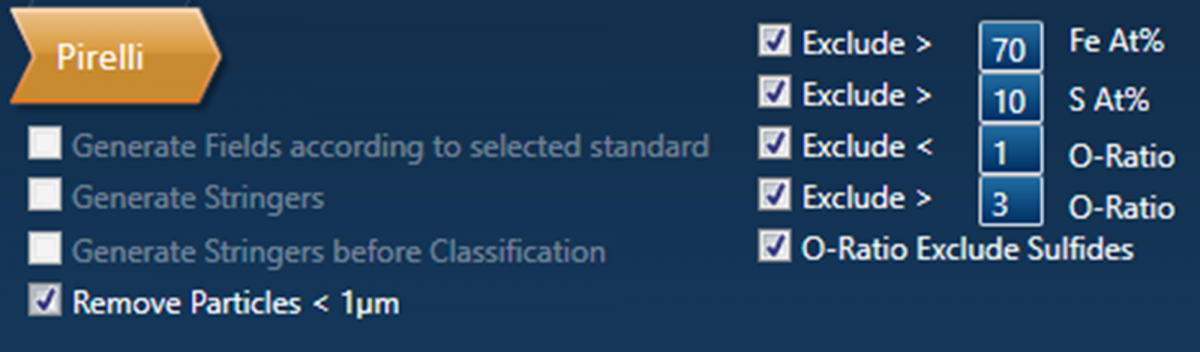
It then automatically analyses the resulting EDS and morphological data to Pirelli Method in Inclusion Classifier with filters to exclude any debris, MnS and particles which are not oxides (Figure 3).

Figure3: Filters used to accept oxide inclusions according to Pirelli Method
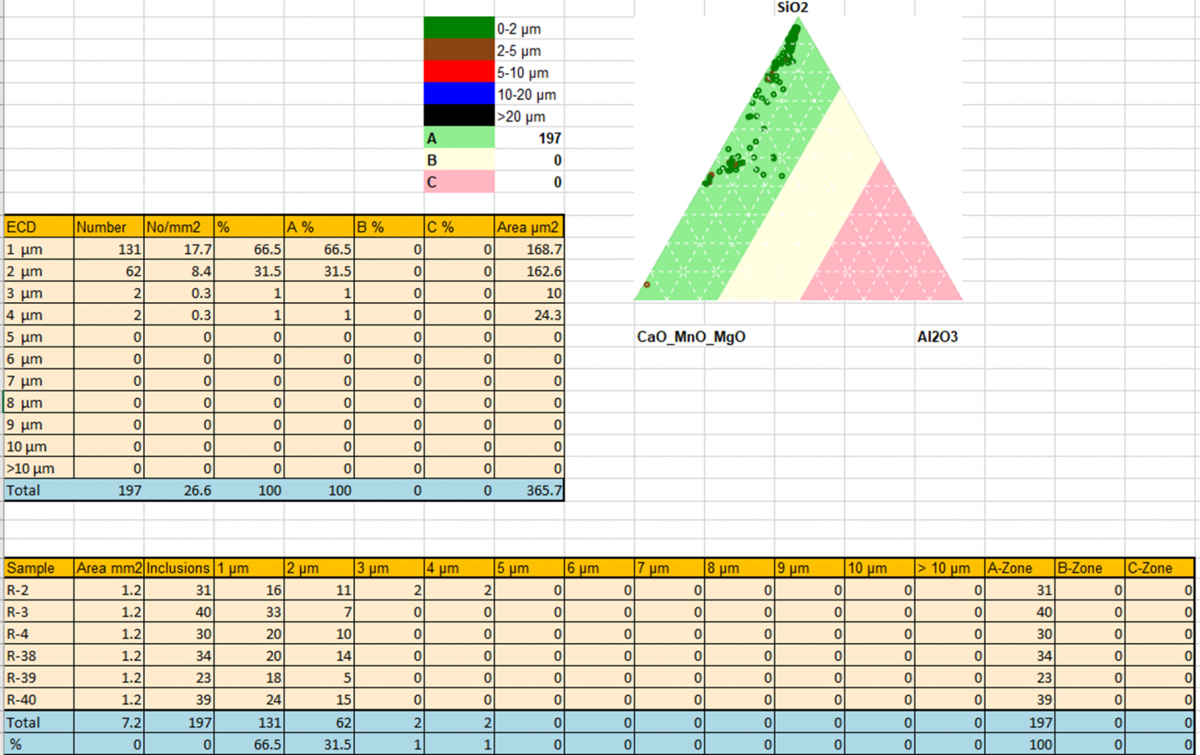
Multiple datasets can be processed simultaneously for combined analysis. It reports:
- Number of inclusions with dimension 1 μm or larger found in each sample and overall
- Frequency distribution of the inclusion dimensions expressed as inclusion number %, respect to the total, belonging to each dimensional class
- Area analysed for each sample and all the heat
- Positioning of the inclusion composition inside the ternary diagram Al203/SiO2/CaO + MgO + MnO, represented in the following image
- % inclusions with respect to the total in the zone A, B, C of the ternary diagram according to Pirelli Method
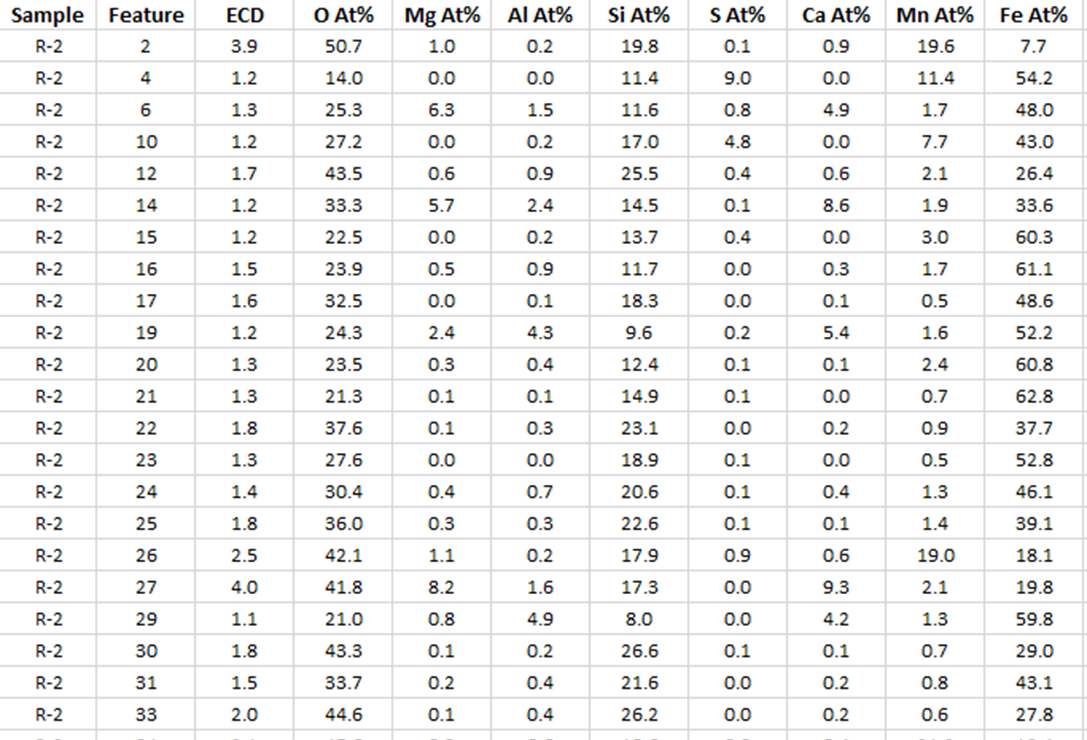
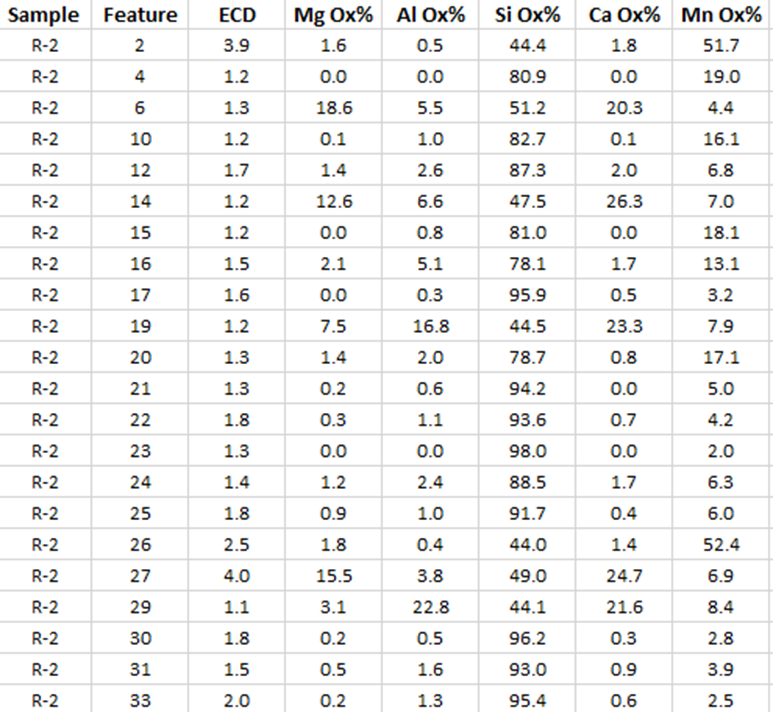
- A qualitative and quantitative analysis (% Wt Al203-CaO-MgO-MnO-SiO2 and % At O-Al-Si-Mg-Ca-S-Mn-Fe) of each inclusion
Figure 4: Reporting in Excel for Pirelli Method. a.: Inclusion size distribution tables and ternary plot; b.: % At O-Al-Si-Mg-Ca-S-Mn-Fe of each inclusion; c.: % Wt Al203-CaO-MgO-MnO-SiO2
of each inclusion.
Hopefully, this gives you an insight of oxides analysis of rod wire with AZtecSteel according to Pirelli Method. AZtecSteel offers a powerful automated solution for the finding, and identification of steel inclusions. It is an ideal tool for analysing rod wire. Data can be classified giving results that comply to Pirelli method. All of the data is reported in MS Excel®, presenting the data in an easily accessible format.