I have spent hundreds of hours on a microscope trying to find the perfect, representative area of my sample to collect data from, an endeavour I am sure a lot of the readers of this blog have also experienced. In many cases, this has been in advance of setting up regions of interest for additional acquisition, for example, queueing up multiple sites for electron tomography. All of this in the hope that one of these areas contains the elusive region or rare event that I am seeking, such as a dividing cell in a tissue, or the best orientation of subcellular structures. Finding these relatively rare events is a continuous challenge in biological electron microscopy.
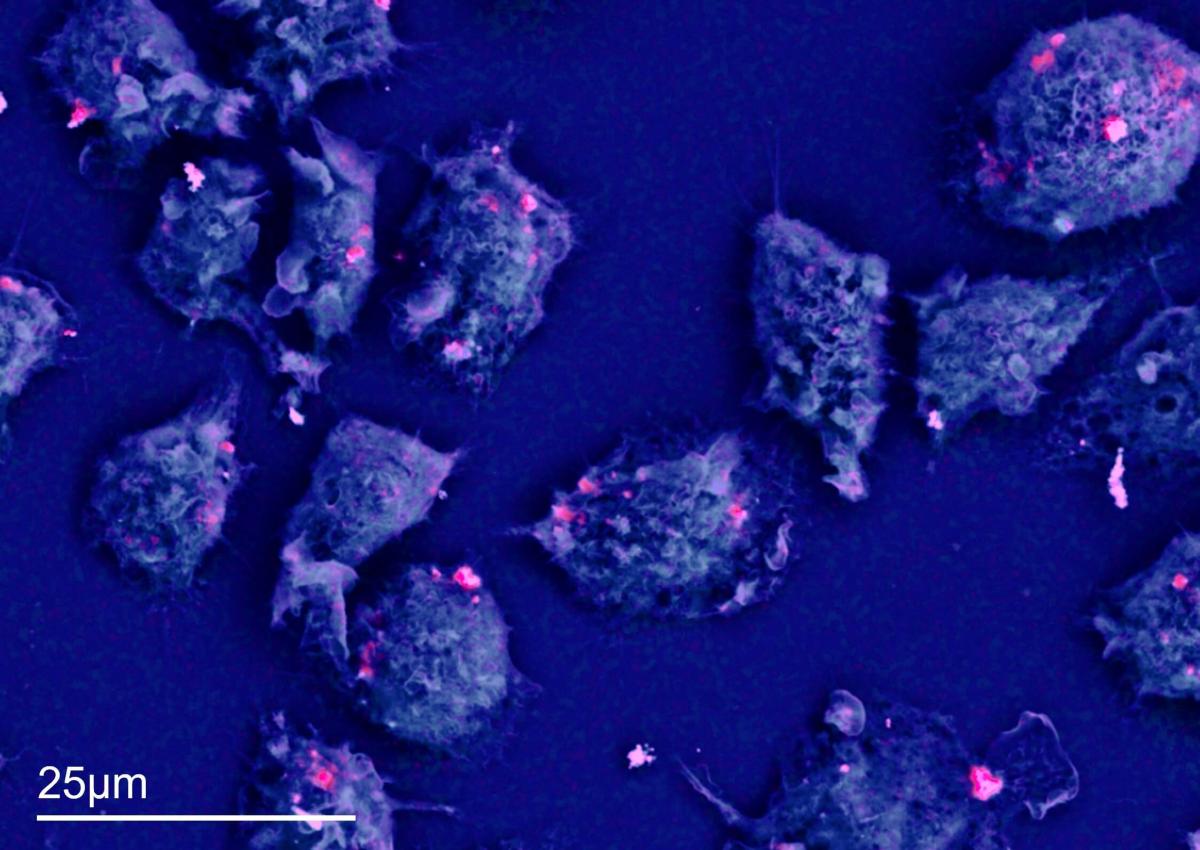
Figure 1 shows macrophages that have been exposed to patient-derived cobalt wear particles (sample courtesy of Zhidao Xia, Swansea University). The blue is the carbon signal, and the pink is the cobalt signal. This layered EDS map took 45 minutes to acquire. Not all macrophages contained the cobalt nanoparticle clusters.
Signals and labels
Labelling and selective staining to highlight a rare event can greatly speed up the localisation of regions of interest (ROI) and the imaging process. This may also require some form of correlative light and electron microscopy. Alternatively, a rapid elemental analysis in the electron microscope using energy dispersive x-ray spectrometry (EDS) can significantly speed up localising ROIs, particularly when searching for discrete native elements or a label with distinctive composition, such as quantum dots.
Standard EDS workflows
The standard workflow with EDS is to use the electron signal to localise a region within the sample and to subsequently collect compositional data. High-quality EDS maps can often take time to acquire (figure 1), particularly from life science samples imaged at low kV, and where the X-ray emission is relatively low. Several regions can be queued up and the analysis itself left to run in an automated fashion. This is particularly useful when acquiring large area maps, a process that captures many individual tiles at higher magnifications and montages them for the final result. In this way, you can cover most of your sample and still have good image resolution, however, this can take a significant amount of time.
Figure 2 is an example of trying to localise clusters of cobalt nanoparticles in macrophages. I hoped that the backscattered electron (BSE) signal would enable me to identify cells containing aggregates of the particles, but EDS analysis demonstrated that the BSE signal alone was not enough (figure 2). Identification of the particles would often take at least 10-15 minutes per site using the standard EDS workflow approach (and often much longer for data containing high image resolution), and that was if I had the correct region in the first place. Using point and ID or spot analysis on EM images alone did not speed this up significantly, as once again the BSE signal was not a good indicator of whether there was cobalt in the cell I had imaged (figure 2), meaning I had to analyse multiple points.
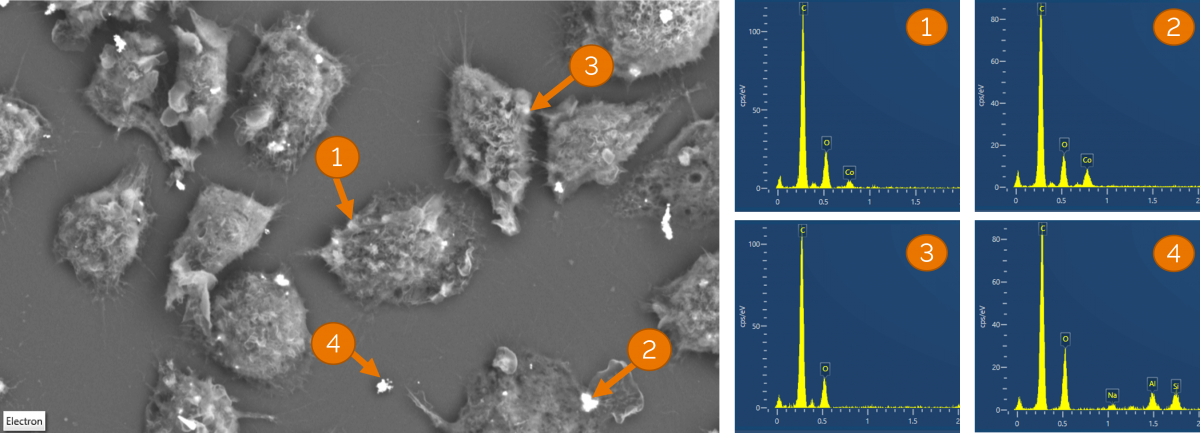
Figure 2 shows a BSE EM image of the same macrophages shown in figure 1. Several areas of similar contrast were selected for point and ID analysis (obtaining a spectrum from a small region that covers the potential nanoparticle clusters). Regions 1 and 2 appeared to be slightly beneath cell membranes, 3 and 4 on the surface of the sample. The spectra from each of these 4 regions shows that the intensity of the BSE signal alone was not able to predict composition or the location of cobalt nanoparticles.
Live chemical imaging
A method that completely changes our standard EDS workflow is live chemical imaging (LCI). This is where both EM images and EDS maps are acquired and overlayed while you move around the sample, providing a live update on sample composition. This works best on samples with few elements and a significant X-ray emission. Biological specimens typically have a lot of different elements in low concentrations and a few elements that dominate (for example, carbon and oxygen). X-ray emission is also relatively low for most biological samples. So, how useful is live chemical imaging for biologists?
Take the example of a rare event or the search for a specific sample. I could image and map the entire specimen in the search for my region of interest, possibly spending days acquiring data. I could use a CLEM approach that likewise might take a significant amount of time and typically involves complex sample preparation. Or I could use live chemical imaging to speed up my search within the electron microscope and focus my time on acquiring the data I need.
Figure 3 shows a video of live chemical imaging to find cobalt nanoparticles in macrophages. The sample was courtesy of Zhidao Xia (Swansea University). The gif image is in live time and shows navigation around the sample, pausing to acquire some additional data and confirm which bright spots on the cells contain cobalt (note that not many do), and spot analysis on a few regions to verify composition. The analysis takes less than a minute, a much faster process than standard EDS workflows.
Using LCI, I was able to speed the search for cobalt-containing cells significantly. I moved around the sample and paused where I found potential ROIs to check for the presence of cobalt nanoparticle clusters. The gif in figure 3 is real time. As you can see, a few seconds pause is enough to show me where the clusters were and is much faster than going through the process of capturing a decent resolution SEM image, let alone conducting analytical characterisation on top. I can export data straight from LCI or, once I have used LCI to find my ROI, I can acquire data using a more traditional workflow.
LCI is a powerful tool for electron microscopists and can significantly speed up any investigation by combining ultrastructural information from the electron images with compositional information from EDS.
Take a look at our website
on LCI for more information and tutorials. For more information on EDS applications in biological analysis and some answers to frequently asked questions, register for my webinar and watch it live or on demand.