The problem:
Acquiring X-ray maps is a great way to find out what elements are present in your sample and how they are distributed. All you have to do with a modern EDS system is press a button to start the acquisition; element peaks are identified, and their associated X-ray maps are displayed automatically. Unfortunately, unless you know that your sample has very small and discrete phases, then it is highly likely that these phases will be missed. This is because the sum spectrum can sometimes be dominated by larger phases, and the contribution from a very small phases may be missed.
The Solution – Spectrum Examiner:
Spectrum Examiner is designed to find these small phases by analysing AZtec’s SmartMaps in detail and highlighting interesting energy regions in the sum spectrum where there is a significant variation in pixel counts.
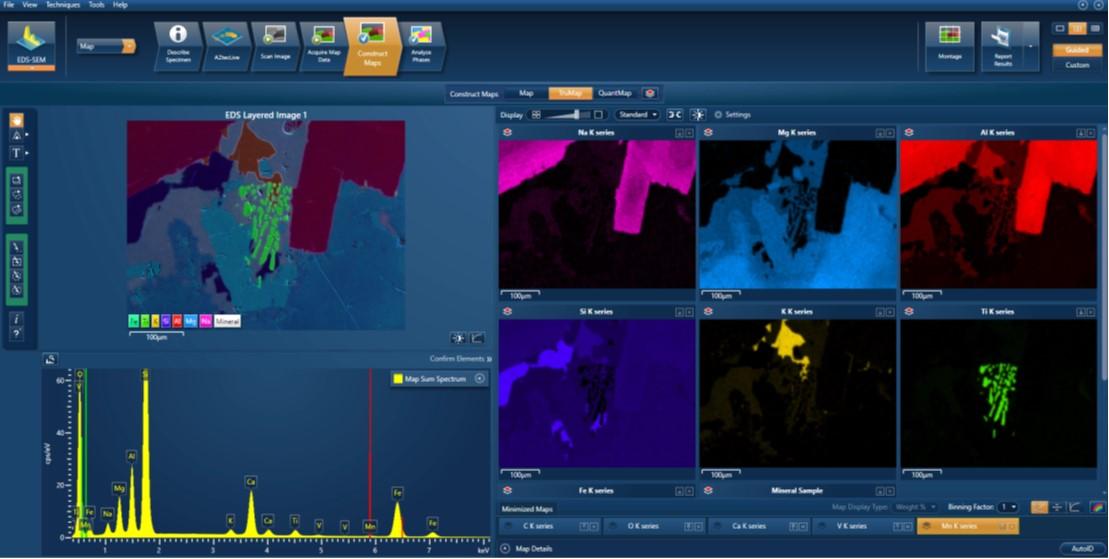
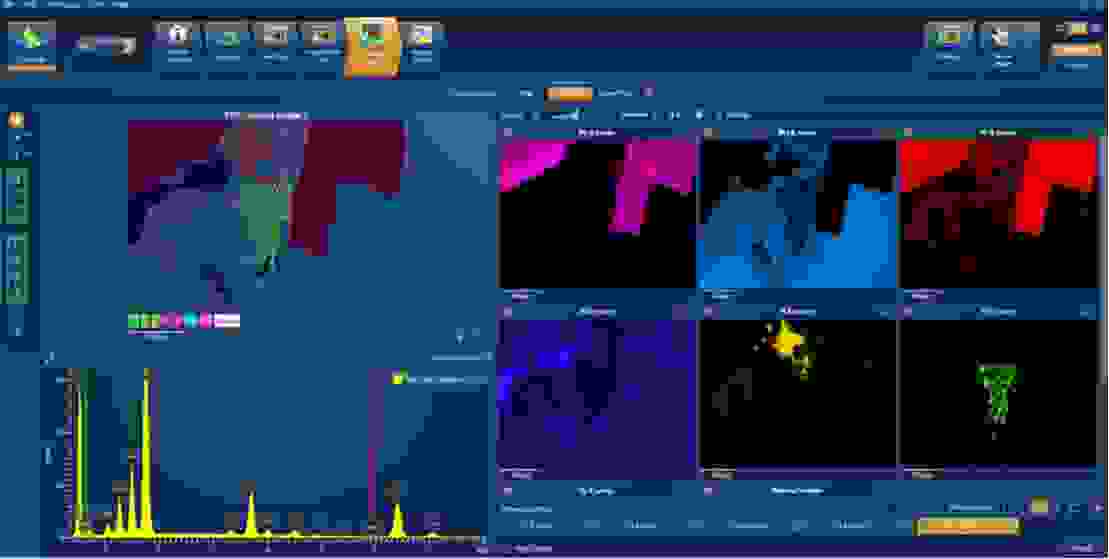
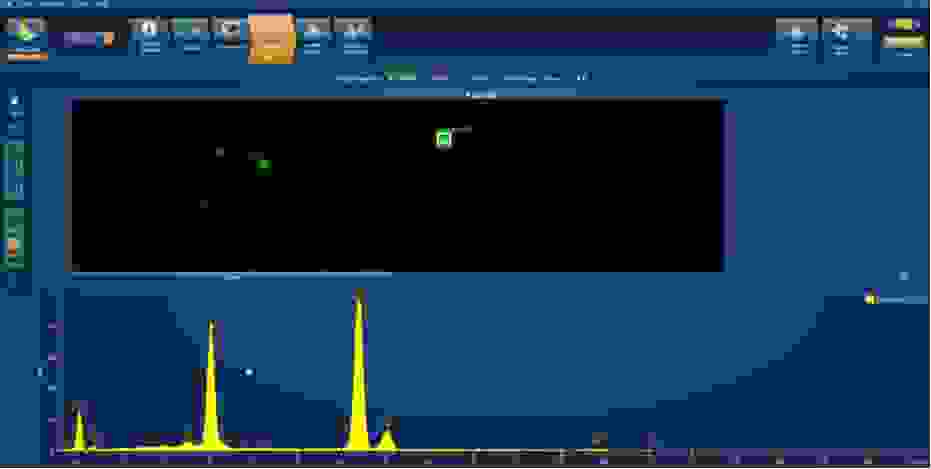
To illustrate this, we can see a mapping analysis of a mineral sample below. AZtec automatically identified the individual peaks and displayed the corresponding X-ray maps.
A first glance at the sum spectra reveals no issues, so the analyst would be forgiven for thinking that they have a representative data set from this area.
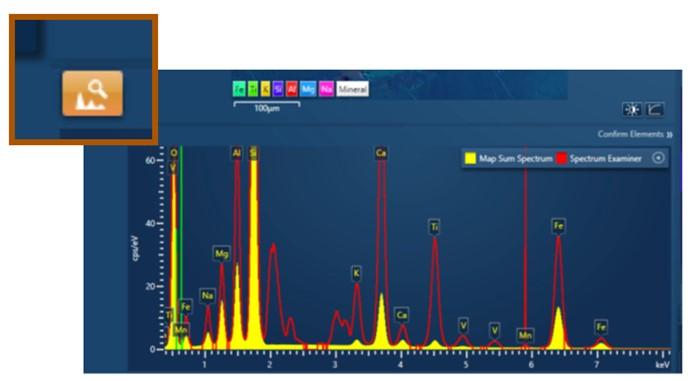
Spectrum Examiner Overlay:
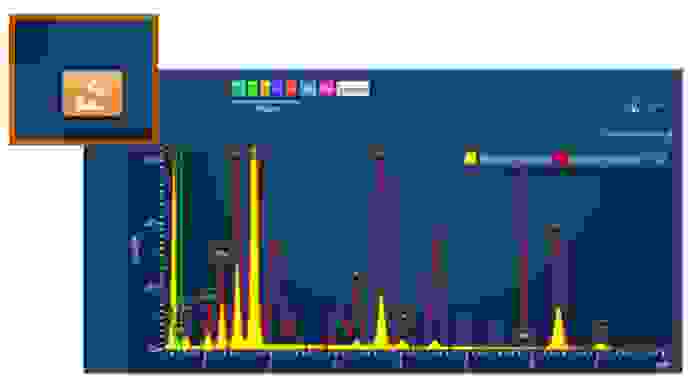
If we activate the Spectrum Examiner button, we then see a red overlay on the spectrum. This overlay highlights interesting regions in the sum spectrum (peaks in the overlay). All a user has to do is look for a peak in the red overlay that doesn’t have a corresponding peak in the sum spectrum.
Candidate Elements:
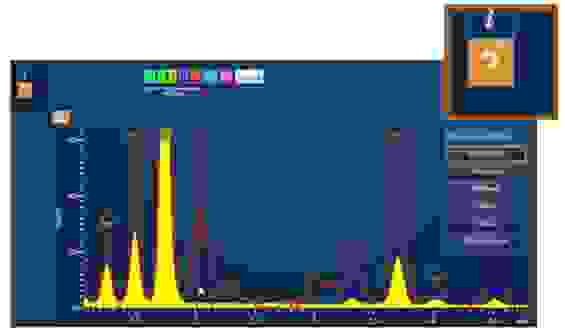
Once such a peak has been identified, the user then clicks on this region to reveal the possible ‘Candidate Elements’ that could be responsible for the peak.
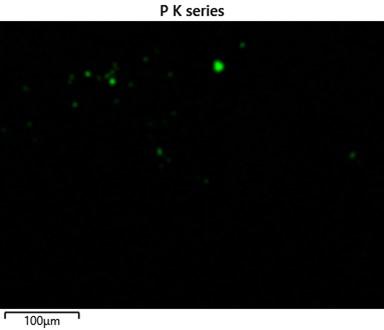
Map of candidate element:
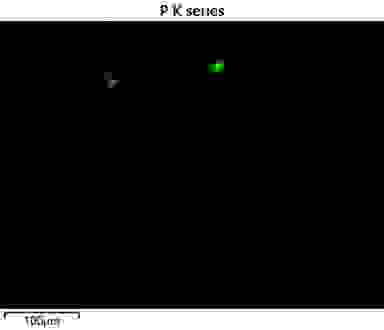
In this case, the most likely candidate for the peak is phosphorus. By clicking on the phosphorus label, AZtec automatically displays the corresponding X-ray map, and we can immediately see that there are small concentrations of P that were missed in the initial inspection.
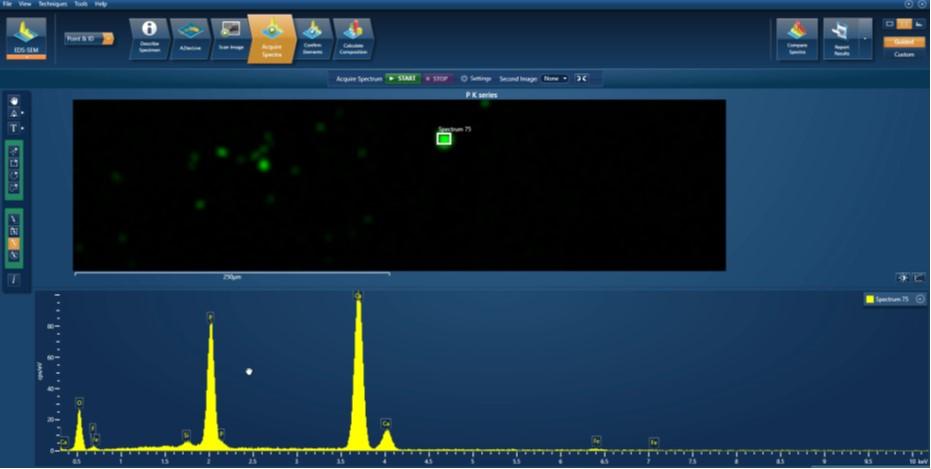
Analysis of detected small phase:
Reconstructing a spectrum from one of these phases reveals significant levels of Ca and P.
Spectrum Examiner is a quick, powerful and easy to use tool that takes the hard work out of ‘Finding a Needle in a Haystack.”