So much has changed with analysis on the SEM, but many fundamental requirements stay the same. Take for example the need to know the limit of detection (LOD) of EDS for a particular element in a particular material. If you ask around about the LOD for EDS, you will hear rules of thumb; some think 0.5wt%, some 0.25wt%, some will even claim 0.1wt% is possible. In reality, the answer is it depends. However, the good news is it can be easily estimated for any element in any material under any experimental conditions. What’s more, the optimum conditions can be calculated before you even go near the microscope, so you know you’re not wasting your time. And if you fail to find the element, you can still be much more confident whether it’s actually there.
This was the case 20 years ago when I wrote an application note to support the introduction of our new spectrum synthesis tool in our INCA software. Being able to accurately synthesise a spectrum for any composition under any conditions is useful for many things. One of the most useful is to calculate the LOD. Over the past 20 years, I have been asked about LOD and each time I have pulled out this application note, which gives the background and workflow for doing the calculation.
With the retirement of INCA, it is time to pass on this task to our AZtec software, and I’m sure for me to write a new application note explaining the method for calculating LOD using AZtec. Similar spectrum simulation capability in AZtec has been available as part of layer/film thickness and compositional measurement software LayerProbe for many years. We are currently introducing a new single layer and bulk measurement and simulation option called LayerProbeONE, which will make this capability much more available to AZtec users. As part of this new software, we are improving the capability to simulate EDS spectra from bulk materials, and that means the calculation of LOD.
Spectrum simulation in LayerProbeONE (or from v6.1 of AZtec for original LayerProbe software) includes the new function to add statistical noise to the spectrum.
With noise enabled in the settings, and with all the other parameters picked up from a spectrum collected on the system, a spectrum for any composition can be simulated which is accurate for the EDS detector and geometry of your microscope.
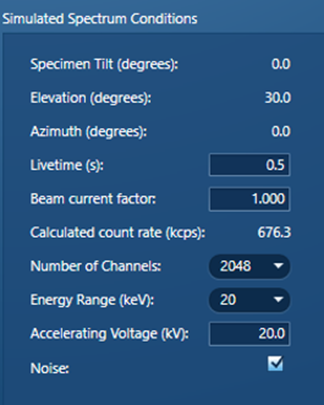
New, updated, settings from LayerProbeONE with the function to add noise to a simulated spectrum
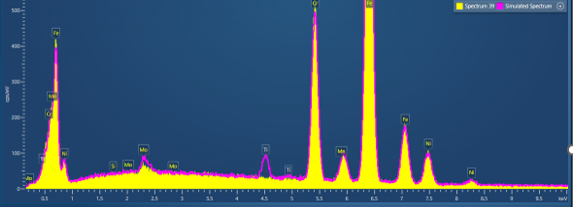
Simulated spectrum from steel with 1wt% Ti added to the composition to check its detectability.
By entering the composition of the material, and then adding a small amount of the element of interest (we add 1wt%), AZtec will give us the precision of the composition measurement for that element from which we can determine the LOD. We can simply vary any parameter, composition of the material, beam current, accelerating voltage etc and see how this changes the LOD. Take for example the detection of Zn in two different materials - a steel and organic matrix - calculated for different accelerating voltages. We can see in the table below that just by changing the composition of the material, the accelerating voltage and the analysed line, the LOD varies between 0.09 and 1.23 wt%. Higher accelerating voltage is clearly optimal for lowest LOD, but if that’s not possible to use, the detectable level can still be determined.
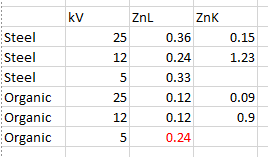
Limit of detection calculated using Spectrum Simulation in LayerProbeONE for Zinc in steel and an organic matrix using different accelerating voltages and measuring different X-ray lines.
Using Spectrum Simulation, you can now be certain about the levels of an element that you can detect in your samples using EDS. Now I better get to it and write that application note and a full explanation of what you can do with Spectrum Simulation in AZtec LayerProbeONE.
Note: Limit of Detection calculation is possible using spectrum simulation in LayerProbe and LayerProbeONE from v6.1 of AZtec software.