I have been very fortunate during both my academic career before joining Oxford Instruments and since joining Oxford instruments. I’ve had the opportunity to access many different technologies to get a better understanding of the materials I have been working with, whether that was dilute magnetic semiconductor nano structures, batteries or meteorites. Moving into a new role in the company to coordinate our activities across different techniques finally gave some legitimacy to magpie-like tendency of looking for the next shiny “toy” to go and play with. That being said, what I have always observed is the power of having all these separate and complementary, sometimes apparently conflicting, data inputs to solving the challenge you are currently facing with your materials.
At Oxford Instruments, we have access to a wide range of tools that give varying inputs on the composition, chemistry, surfaces and structures of a sample. This has become more accessible for the team and me as we have recently opened our new innovation centre at the materials analysis headquarters in High Wycombe, UK. This facility means that we have all our techniques (EDS, EBSD, BEX, WDS, AFM, NMR and Raman) under one roof. Having this capability now means that whenever we get new materials to analyse, they often go into all the labs not just one. This has already started to produce interesting results and new insights into materials we see.
One of the most apparent complementarities on the SEM is between EDS and Raman. In my early career, I believed EDS told me everything I needed to know about my samples’ elemental compositions. I then spent 5 years working with our NMR tools and became aware how those atoms analysed by EDS are held together with chemical bonds. This was news to me and made me realise I had been ignoring the bigger picture.
Raman as a technique doesn’t see those atoms and just see the bonds, giving incredibly detailed information about the molecular structure, including whether there is stress, strain or disorder in those structures.
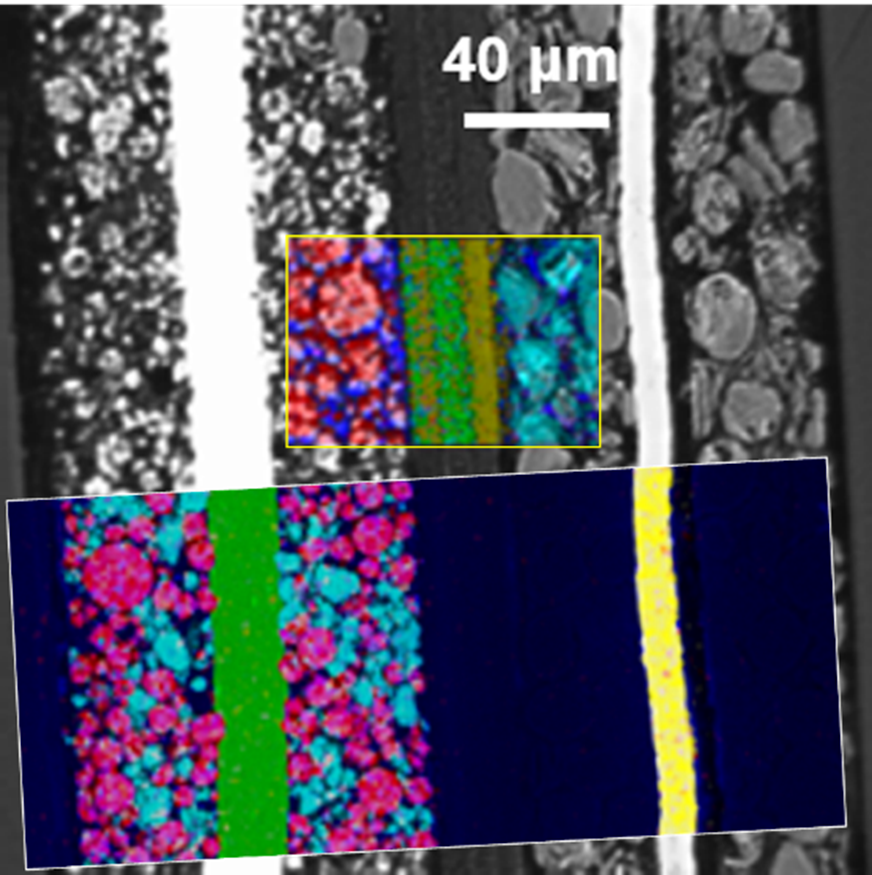
Seeing the data from the two sources really does complete the picture. So much so that we couple both on the SEM now with RISE. This makescorrelating these two critical data inputs very easy. One very clear example of this is seen when analysing batteries. If we take a battery cross section and analyse it with EDS, we see the two current collectors (Al & Cu) and the cathode, typically a transition metal oxide; the rest would be carbon. Analyse that same area with Raman, and we can resolve the different carbonaceous materials present, polymer separator and graphitic anodes. Not only that, but we are able to begin to visualise the degree of lithiation of the cathode. This is a very obvious and immediate visualisation of the power of combining techniques.
Figure 1: showing overlaid Raman (yellow box) and EDS (white box) data on a backscattered electron image. EDS shows beautiful colours for cathode and current collectors but no structure in the dark blue carbon. The Raman shows structure in all the components.
As we further explore this space, we are finding more and more examples where such a combined approach is improving our understand of materials at all length scales. Recently, concrete has become a topic of increased research interest for several reasons. In the UK, structural safety has been grabbing new headlines, while globally, the environmental impact of concrete is drawing increasing focus.
Key to understanding the environmental impact, either through carbon emissions through its life or potential for carbon storage, is understanding the physical and chemical microstructure of the material. Having recently conducted an interesting (if time consuming) experiment to understand how the microstructure of concrete changes as it dries using time domain NMR, we were able to take the same or similar sample and look in detail at the microstructure and understand not just the elemental distribution but also the chemical information.
It is this chemical information that is all important as it allows us to identify hydrated and dehydrated calcium silicate. As the NMR experiment measures bound hydrogen one of the components of relaxation signal, the fastest relaxing, can be associated with this C-S-H phase. This enables nanoscale spatial correlation and much larger scale proportional volumetric data.
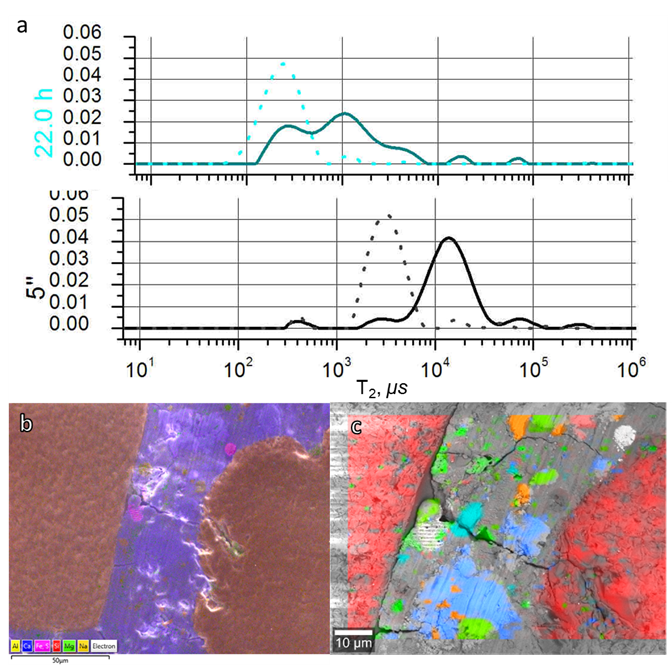
Figure 2: a) T2 distributions for two different concrete samples after 5 minutes (black) and 22 hours (blue). b) EDS map showing Calcium (blue) and Si (red) rich sample regions. c) Raman image collected from the area shown in 2b distinguishing different chemical compositions, Quartz (red), C3S (Blue) metal oxides (green) and most importantly C-S-H (orange).
Even with just these two examples it is clear how much extra insight can be gained from brining technology together. I am very excited to see more and more of these cases as we begin to truly utilise our new innovation centre.