It’s a bit of a paradox. SEM-EDS is a technique for understanding the elemental composition of materials on the micro- or nano-scale, however, its often used to ‘measure’ the composition of the bulk material itself. The method is simple, choose a low magnification, collect a spectrum from a large area and quantify the spectrum. Some methods collect several spectra from different areas to ensure a representative composition is obtained.
There is, however, a fundamental problem with this approach: the matrix correction. The matrix correction in quantitative analysis (ZAF, Phi-Rho-Z, XPP etc) corrects for effects of atomic number, absorption and fluorescence due to differences in the composition between the material measured and the standards used. Its particularly important for standardless methods, where the standards used to calibrate these methods are normally pure elements or simple binary compounds that may be far away in composition from the materials being analysed. So what’s the issue? The issue is that the matrix correction works if the material being measured is homogeneous (i.e. 1 phase with 1 composition). As materials have more phases and changes in composition the matrix correction will show larger errors.
Therefore, if you are measuring a material with no microstructure or compositional variation, this blog may not be for you. If, however, you are interested in the bulk composition of a more complex multi-phase material then read on.
An alternative approach to measuring the composition of materials
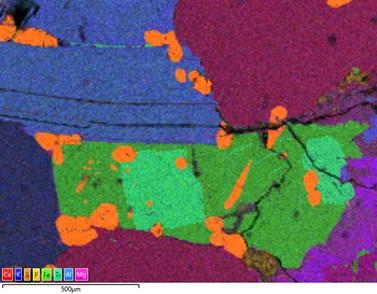
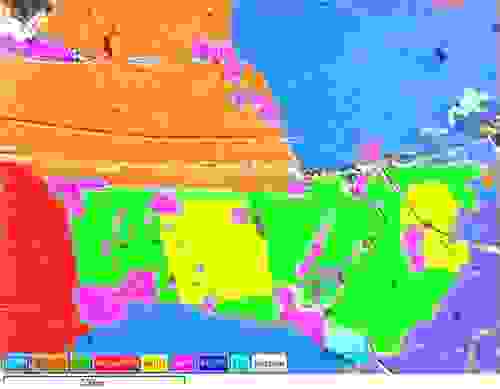
For this blog I thought I would investigate a possible way around the matrix correction problem. I chose a rock sample that has several different mineral phases with differing compositions. A composite map over a typical area of the sample shows a number of different phases, characterised by different elements (see below).
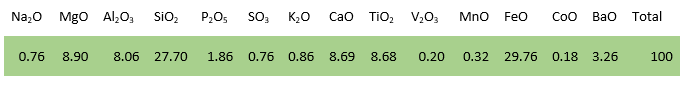
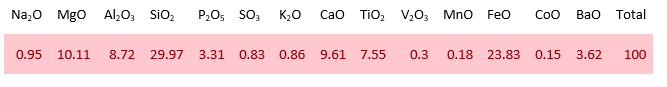
Using the traditional method and collecting a spectrum, the composition of this area (in oxide %) is:
But how much of a problem is the matrix correction issue? As this sample clearly is not homogeneous.
AutoPhaseMap to the rescue?
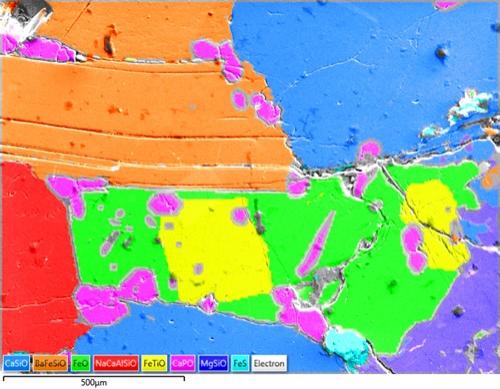
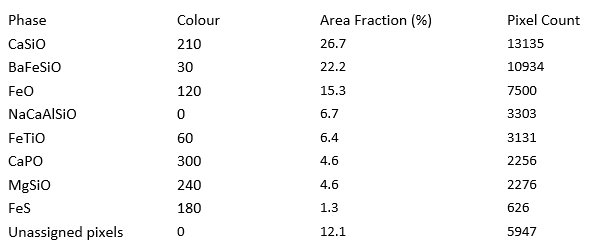
A potential alternative approach is to find all the areas (phases) of the same composition in the sample and determine their composition and abundance. In the AZtec software this is what AutoPhaseMap can do for you. Taking the same Smart Map dataset as above, AutoPhaseMap splits the data into regions of the same composition, calculating the composition of each phase and its area %.
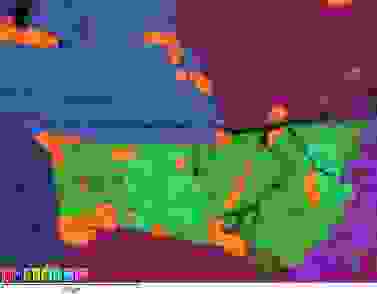
Or looking at the data another way, here are the identified phases displayed on an electron image of the area.
There are some quite different phases in this sample - oxides, silicates, phosphates and sulfides, and a range of elements from oxygen through to barium.
How can we turn this data into a composition for this area? Firstly we need the composition of each area as calculated by AZtec from the spectra calculated by AutoPhaseMap for each area, as shown below.
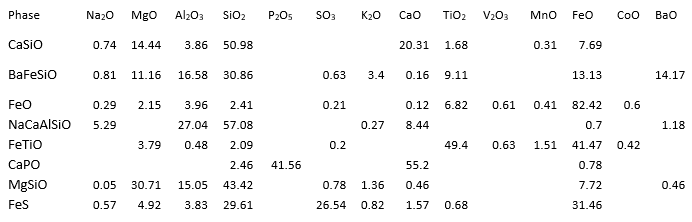
Next we have to correct for the amount of each phase, by determining the wt% of each phase in the area. This is determined from its area % (as calculated from AutoPhaseMap) and the density of each phase (taken from webmineral.com).
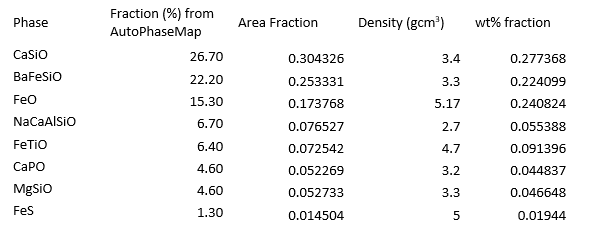
Adding up the composition of each phase corrected for the weight fraction of each phase, we can determine a total composition for the area.

And then compare with the composition determined using the ‘traditional method’ described earlier:
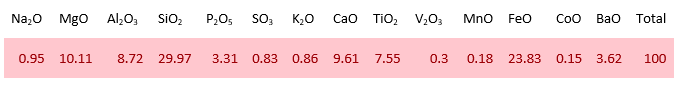
If we compare the two results, we can see that we have a similar result, but one that is different in detail. In general, the AutoPhaseMap method predicts lower concentrations for lighter elements and higher concentrations for heavier elements. For example, the level of P2O5 calculated by our proposed approach is almost halved compared to the traditional method, and the level of FeO is nearly 6 wt% more.
What did we learn from this experiment?
As this is a blog I won’t discuss the potential errors in each method in great detail. Our proposed method for using EDS to determine the bulk composition of multi-phase materials is clearly more complex and also comes with some potential errors that you may want to consider. For example, the densities are approximate based on an identification of the phase rather than the composition. You may have also spotted that I completely ignored over 10% of pixels that were not assigned by AutoPhaseMap. These are minor phases, pixels which have mixed composition from surrounding phases, and mostly alteration phases formed recently in the history of the rock. Should these be included, or not?
As is so often the case, which method to use largely depends. For one thing the more homogeneous the material, the smaller the issues with the matrix correction will be. Another thing to consider would be the accuracy and precision required, is the difference between the two methods within the uncertainty required.
My take-away is don’t just assume you can use a low magnification spectrum acquisition to determine the bulk composition of a material to high accuracy. If you have AutoPhaseMap in your AZtec software, and are looking at multi-phase samples, why not give that method a try. At least you can see whether it makes a significant difference, and therefore whether it may be worth considering.
If you know the bulk composition of a material, which was certainly not the case for my sample, it would be very interesting to hear which method you find gives a better approximation of the bulk composition.