10th February 2021 | Author: Kim Larsen
3D imaging of samples in FIB-SEM has become almost routine in recent years; The method works by sequentially milling a sample with an ion beam (to remove material) and imaging the result, the stack of images can then be used to create a 3D reconstruction. It is common to automatically map and mill a sample for hundreds of slices. The obvious extension to this been to add 3D analytical information.
The integration of both EBSD and EDS in this process means that all possible information about the sample is captured, stored and can be interrogate subsequently which is particularly important due to the destructive nature of the technique. Recent developments which increased milling rates such as new plasma FIBs and laser-based ablation techniques inside focus ion beam microscopes have resulted in ever increasing volumes being examined. In order to keep up, the use of high-speed CMOS based EBSD detectors and large area SDD EDS detectors has become imperative.
There are certain applications where the materials structure is inherently heterogenous in three dimensions and there 3D analysis is required to truly characterise and understand the structure-property relationship in a sample. I have listed some common examples below:
- 3D printed components with microstructural variability
- Modern semiconductor devices, which use complex 3D components
- Welds and metal bonds, due to mixed materials and a complex thermal history
- Asymmetrical microstructures were 2D analysis is not representative
In addition, almost any sample can benefit from occasional 3D analysis, even if just to confirm a 2D map is representative of the material.
When it comes to performing 3D analytics (specifically EBSD) there are two distinct methods which can be used: static and dynamic.
In the dynamic method the sample position is changed between milling and mapping so that it is in the optimum geometry for both analysis and milling. In the static method, as the name implies, the sample position does not change between milling and mapping. Each method has its own advantages and disadvantages such as time taken to perform stage movement, sample requirement, milling time etc.
The best option often depends on your application and personal preference
As a provider of analytical equipment, Oxford Instruments took the decision to integrate into the microscope manufacturers 3D software packages and let the microscope manufacturers software control the microscope instead of creating our own bespoke 3D package. The analytics part is still set up in our own 2D analytics software package. This is different to what we do in 2D, where we mostly offer our own software that drives both the analytics and the microscope. However, when you look our approach in detail it has numerous advantages.
Firstly, it means that both static and dynamic approaches are available, depending on the vendor, without being limited by our implementation. Furthermore, by integrating into existing 3D software packages, the user avoids the need to learn an additional software package but builds on the users knowledge of the microscope software and our 2D software package. In practice, the integration of our 2D software with the microscope’s 3D software means that performing 3D analytical analysis simply requires the setting up a 2D EBSD map and selecting a tick box in the 3D software to repeat the map on each slice. While a lot is going on in the software behind the scenes to make this happen, from the user’s perspective this integration is simple.
An example of this can be seen below.
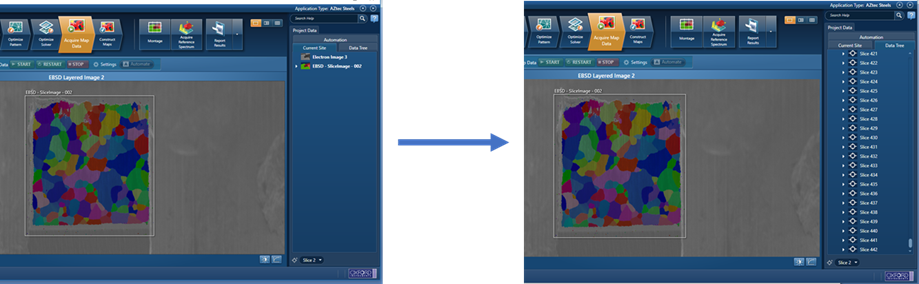
Screen grab from AZtec showing a single map set up in 2D, then automatically repeated on multiple slices to create 442 EBSD maps for a 3D reconstruction.
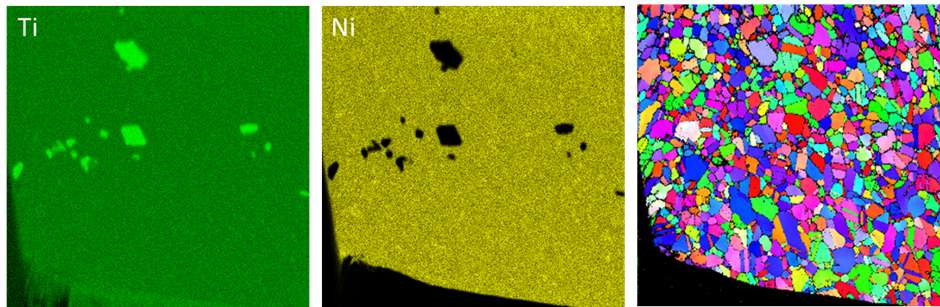
Another advantage of our approach is that new developments in in 2D can be quickly implemented into 3D. A good example of this is AZtec TruPhase. This is an innovative tool which combines EBSD and EDS while mapping for accurate phase maps of similar crystal structures. While initially created as a 2D tool, it can be used in 3D and adds confidence in the destructive analysis performed. The example below is a single slice taken from a 3D run, showing an additively manufactured nickel superalloy with two crystallographically similar, but chemically different phases. The use of the TruPhase means the correct phase can be easily assigned.

Additive manufacturing Nickel super alloy with 2 phases that are crystallographically similar, but chemically different. The use of simultaneous EDS and EBSD with TruPhase means they can be accurately and easily resolved. Data courtesy of the University of Manchester.
An advantage of 3D EBSD over competing techniques is the ability to resolve twin boundaries, which can affect a materials mechanical performance. The stack of EBSD maps below was acquired from a sintered copper material, in this reconstruction the location of twins and voids are clearly visible.

3D view of a sintered copper showing the twin structure in the particles, which is not visible in conventional X-ray CT analysis. Data courtesy of the University of Manchester.
As FIBs and detectors continuously improve, the use of 3D analytical analysis will only continue to increase. To find out more about our 3D analytical solutions visit our application library or contact one of our application specialists to discuss options available for your system.