Detecting impurities in Fusion plasma by EUV Spectroscopy

Researchers around the world are studying fusion as a potential source of energy. Fusion is considered to be safer than today’s nuclear fission power plants because it can occur only under very limited and controlled circumstances. However, fusion is very much still in the research stage.

Dr. Shigeru Morita of the National Institute for Fusion Science in Japan is part of a group of researchers involved in magnetically confined plasma research. ‘We need a large effort over a long time to realize a fusion reactor,’ Dr. Morita said. ‘But I believe that fusion is the best solution to yield electricity for the future.’

One way to perform fusion is with magnet confinement, which uses magnetic fields to confine the hot fusion fuel in the form of a plasma. The researchers want to understand impurity transport in magnetically-confined plasmas in order to better control impurities in the fusion plasma. Impurities can cause radiation loss and affect fuel dilution, causing a reduction in the fusion energy output.

Most impurities emitted from the fusion plasma require spectroscopic detection in the extreme ultraviolet (EUV) wavelength range (10 to 500 Angstrom or 1 to 50 nm), which can pose a challenge for detection. Because the researchers were studying impurities in magnetically-confined plasmas in the large helical device (LHD) at the National Institute of Fusion Science, they also needed a relatively large detection area in order to observe the 1-m radial profile of the LHD plasma.

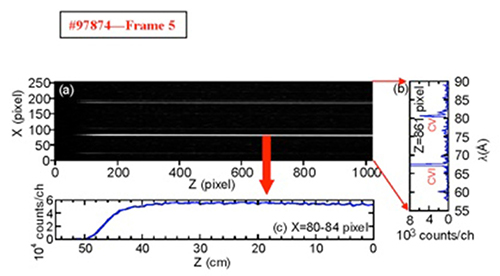
This example of a space-resolved EUV line image was taken from EUV spectrometer with a back-illuminated CCD

Fig. 1. This example of a space-resolved EUV line image was taken from EUV spectrometer with a back-illuminated CCD. The horizontal axis (Z) and vertical axis (X) denote the vertical position of LHD plasma and wavelength, respectively. Spectrum is indicated in right-hand inset, which is taken at Z=#861 pixel, and the vertical profile of Carbon 6 (CVI) (2nd order: 2x33 Å) is shown in bottom-side inset, which is taken at X=#80-84 pixels.

Previously the researchers had used a microchannel plate (MCP) combined with a photodiode array for EUV spectroscopy, but this set up exhibited a high amount of thermal noise and poor spatial resolution. To use a CCD detector for EUV spectroscopy would require the sensor to be uncoated and to be fairly large. For these reasons the researchers turned to the Andor DO420-BN CCD camera to meet these requirements. ‘Using the back-illuminated CCD for the detection of EUV light worked very well and showed much less thermal noise, good spatial resolution and a high count rate,’ Dr. Morita said. ‘It dramatically changed the EUV spectroscopy performed in the fusion study.’

The sensor in the Andor DO420-BN CCD camera is back-illuminated with no anti-reflection coating. The 1024 x 255 array with pixel size of 26 x 26 um2 gives an active area of 26.6 x 6.6 mm. The researchers incorporated this camera into a EUV spectrometer system consisting of an entrance slit, a spatial resolution slit, and a gold-coated concave varied-line-spacing (VLS) grating. The CCD can be cooled to -70 °C to reduce the thermal noise, but the researchers typically operated it at -20 °C, which provided sufficiently reduced thermal noise.

They placed the CCD vertically at the focal plane of the spectrometer, so the vertical profile was recorded along the CCD’s long axis (z axis: 26.6 mm, 1024 pixels), and the spectrum was recorded along the CCD’s short axis (x axis: 6.6 mm, 255 pixels). They used the camera in full resolution image mode for the spectral resolution test and for the line identification. This mode delivers the best spectral resolution but requires a longer exposure time. For routine measurements of the impurities, they used the camera’s cropped mode function.

Using the Andor DO420-BN CCD camera, we could observe the radial profile of impurity line emission from LHD fusion plasmas in EUV range to study the impurity transport,’ Dr. Morita said. ‘This was the first time in magnetic confinement fusion research that the radial profile was observed in EUV range with such good results.’

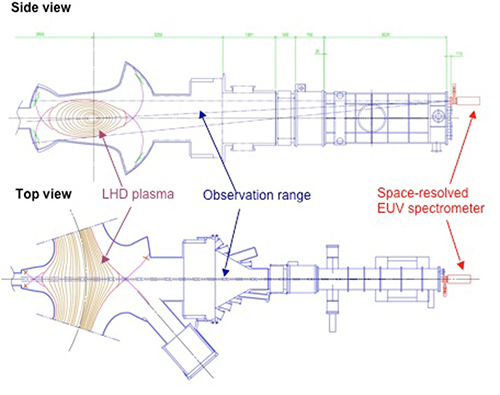
Schematic drawings of space-resolved EUV spectrometer installed on LHD in side view and top view

Fig. 2. Schematic drawings of space-resolved EUV spectrometer installed on LHD in side view and top view. The magnetic surface structure of the LHD at R=3.75 m plasma axis position shown on the left.

The researchers used the space-resolved EUV spectrometer to measure the radial profiles of impurity ions of carbon, neon and iron for high-temperature plasmas in a large helical device (LHD). The measurements were performed in the wavelength range of 60 to 400 Angstroms and revealed information not previously known about the plasma impurities. For example, they found that impurity ions with ionization energies between 0.3 and 1.0 keV were located in the outer region of plasma while those with ionization energies of less than or equal to 0.3 keV were located in the ergodic layer.

Importantly, they also found that the electron temperature is approximately equal to ionization energy for impurity ions with ionization energy less than or equal to 0.3 keV, while impurity ions with ionization energies between 0.3 and 1.0 keV have an electron temperature roughly half that of their ionization energy. This probably occurs because of the difference in transverse transport between the plasma edge and the ergodic layer. Combining this information with other results allowed the researchers to qualitatively explain the differences in the impurity radial positions

They also carefully examined the peak position of CIV, which was identified as the ion existing in the farthest edge of the ergodic layer. It was found that the position moves inside the ergodic layer when the edge electron temperature was reduced below a threshold temperature, e.g. where it does not change at all in a temperature range above the threshold. This indicated that the edge boundary of LHD was determined by a starting point of the open field layer near the O-point, not the X-point. Comparison with a three-dimensional edge transport code in the CIV peak position showed a clear discrepancy of 8 mm, suggesting a modification of the stochastic edge magnetic field due to the presence of plasma pressure.

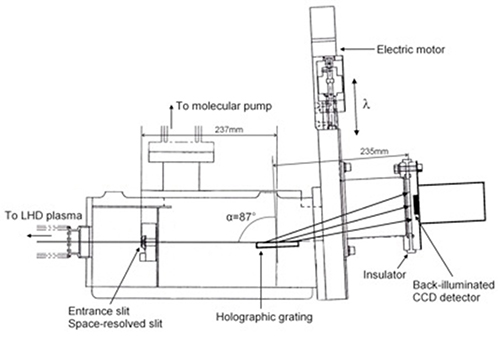
Space-resolved EUV spectrometer installed on LHD. Spatial resolution in vertical direction is adjusted by a spaceresolved slit

Fig. 3. Space-resolved EUV spectrometer installed on LHD. Spatial resolution in vertical direction is adjusted by a spaceresolved slit. A wavelength range of 60 to 400 Angstroms can be observed by moving the CCD detector. It should be noted that the wavelength range has been expanded to 30 to 650 Å after modifying the scanning system of the CCD.

Research Papers

1) Chunfeng Dong et al, A Study on plasma edge boundary in ergodic layer of LHD based on radial profile measurement of impurity line emissions, Physics of Plasmas, Vol.18 (2011), 082511, doi:10.1063/1.3626540.
2) Chunfeng Dong et al, Study on Radial Position of Impurity Ions in Core and Edge Plasma of LHD Using Space-Resolved EUV Spectrometer, Plasma Science and Technology, Vol.13, No.2 (April 2011), pp.140, doi:10.1088/1009-0630/13/2/03.
3) Chunfeng Dong et al, Space-resolved extreme ultraviolet spectrometer for impurity emission profile measurement in Large Helical Device, Review of Scientific Instruments, Vol. 81 (2010) 033107, doi:10.1063/1.3299060.

Date: N/A

Author: Andor

Category: Application Note

Download as pdf

Share

Related assets